Environmental Engineering Reference
In-Depth Information
Determination of the effective probability of detection
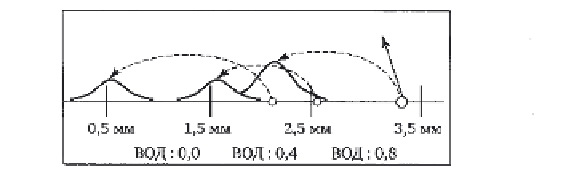
Figure 9.18 shows the statistical modelling procedure. Let a crack 2.7 mm
long be detected for the first time at the
i
i-th ISI. The history of growth of
this crack can then be obtained by inverse modelling of crack growth. Since
PDD is a function of crack size, the value of PDD can be calculated for each
ISI. From these values we can calculate the actual PDD, i.e. effective PDD.
Repeating the simulation many times, the average value of the effective PDD
can be determined.
For a particular inspection method the effective PDD is regarded as a
function of crack size for each ISI. The number of actual cracks of a given
length or length range can be obtained from equation [9.13].
The curve effective PDD for each ISI is plotted using the following
procedure in which crack growth is simulated by the Monte Carlo
method. The curve of effective PDD in the
k
-th ISI is obtained as follows:
1) a crack with length
a
i
in the
k
-th ISI is considered;
2) reversed crack growth back to the size of the minimum detectable
crack length is simulated. A random variable
Z
is renegerated during
simulation and, using equation [9.1], the crack growth rate is calculated;
3) the size of the crack and the corresponding values of PDD for each
of the previous cycles of ISI are determined;
4) the resultant PDD values are used to calculate the effective value;
5) many estimates of the effective PDD are produced, repeating steps
(1) to (4), and the average effective PDD is calculated.
6) steps (1) to (5) are repeated for increasing length
a
i
+ Δ
a
to the
k
-th
ISI and the average value of effective PDD are determined for different
crack sizes.
PDD values used in the simulation are presented in Table 9.1. Modelling
was carried out using discrete PDD values, as it is more convenient to
calculate the number of actual cracks.
Discrete and continuous PDD curves, used in the simulation in each
ISI, are shown in Fig. 9.19. Since the non-destructive testing system was
changed after the 9th ISI, the PDD
curve also changed after the 9th ISI.
The effective PDD was used to estimate the actual number of defects
with the inspection results taken into account. Figure 9.20 shows the
2.7 mm detected cracks
0.5 mm
1.5 mm
2.5 mm
3.5 mm
PDD: 0.0
PDD: 0.4
PDD: 0.8
9.18
Scheme of statistical modeling to assess the history of the
crack growth.

Search WWH ::

Custom Search