Environmental Engineering Reference
In-Depth Information
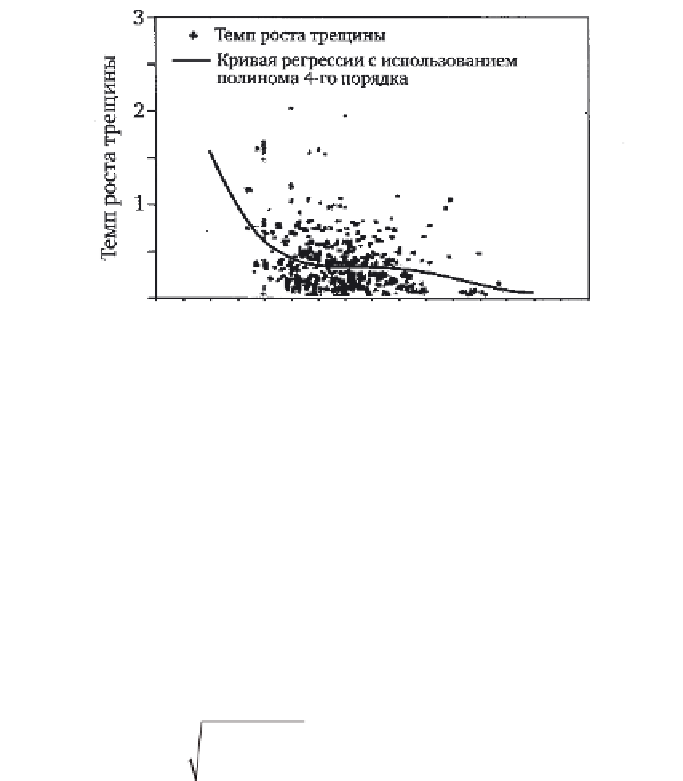
Crack growth rate
Regression curve (polynomial of the
fourth order)
Crack length, mm
9.16
Crack growth rate data and the polynomial curve.
=
da
log
log
C a
log
+l
log
z
+
.
[9.3]
dt
The constants
C
and λ can be obtained from the linear relationship between
the variables log
a
and log (
da/dt
). Figure 9.15 shows the regression analysis
results. The logarithmic scale is used for both horizontal and vertical
axes. The graph shows a linear dependence and, for comparison, the fourth-
degree polynomial. It may be noted that the difference between the straight
line and the polynomial curve is small.
The value of log
z
was evaluated by statistical analysis of deviations
from the mean
RSME
. Calculations were carried using the following
formula
130
:
∑
ˆ
(
i
YY
−
)
2
[9.4]
RMSE
=
,
n
−
2
where
Y
i
is the crack growth rate determined in the observations;
Y
is the rate
calculated by the regression equation;
n
is the number of data (experimental
points).
Distribution of log
z
can be described by a normal distribution which can
be used to obtain the crack growth rate in the statistical representation [9.3].
The probability of detecting cracks and the number of actual fractures
The means and methods of nondestructive testing have been developed for
detecting small defects. In reality, both small and large defects can remain
undetected during inspection. This is due to insufficient reliability of the
existing inspection methods.
Unreliability of ISI can be divided into unreliable detection of the
defect size and insufficiently accurate detection of defects. Unreliability of
estimates of the defect size can be accounted by statistical analysis of the


Search WWH ::

Custom Search