Environmental Engineering Reference
In-Depth Information
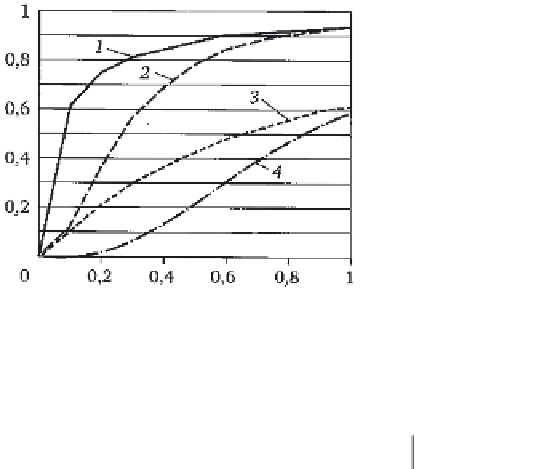
Ratio of defect depth to wall thickness
7. 1 2
Detection of defects: 1) good; 2) normal; 3) poor; 4) very poor.
Table 7.1
Constants c
1
and c
2
for different defect detectability
The level of detection of defects
c
1
c
2
Good (good availability, automatic and manual examination by
ultrasound inspection)
1.526
0.533
Normal (normal availability by using only manual examination by
ultrasound inspection)
1.600
1.200
Poor (poor availability, using manual ultrasound inspection
technique)
0.300
0.700
Very poor (radiography)
0.240
1.485
where the constants
c
1
and
c
2
take the following values (see Table 7.1).
The risk of failure is determined as follows:
The risk of
i
-th component
P
f
(probability of failure)·
C
f
(consequence
of failure);
Probability of failure of welded joint
P
=
SL
+
LL
+
P
f
where SL is the small leak; LL is the large leak,
P
f
=
PC
is the probability
of failure;
P
is the probability of failure as a result of annual degradation of
the welded joints;
C
is the probability of reduction of the safety of the entire
system as a result of degradation of the welded joints.
(The same procedure can be used to determine the risk for other
degradation levels).
The risk for the entire pipeline system is equal to the sum of the risks
of each welded joint.
Depending on the level of risk, the following intervals between
inspections are selected (Table 7.2).
In addition to the previously described programme RBI-1, alternative
RI-ISI programmes were developed (Fig. 7.13):


Search WWH ::

Custom Search