Environmental Engineering Reference
In-Depth Information
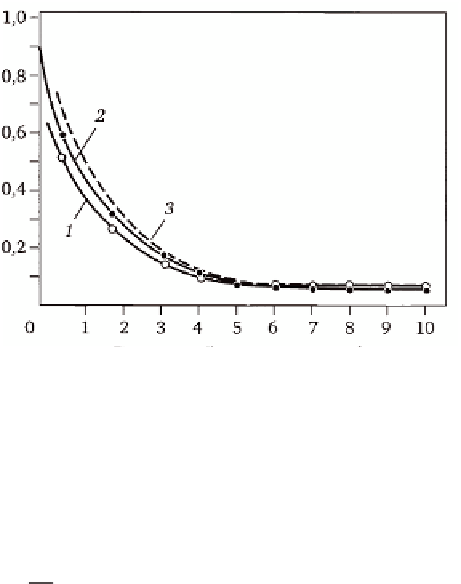
Order number of inspection k
5.36
Residual defectiveness after
k
inspections;
N
res
is the number
of undetected defects in inspection;
N
in
is the total number of defects
in the test sample DN800, 1) experimental curve, 2) calculated
curve at
ε
= 0, 3) calculated curve with
ε
= 0,05.
[
]
(
N
)
k
=
N
k
−
1
(1
exp
−
(
aa
−α −
[5.17]
)
res
res
0
or
A
[
]
(
N
)
k
=
exp
kaa
(
−α −
[5.18]
) .
res
0
a
n
Calculations using equation [5.17] yielded the calculated curve (2) (Fig.
5.34). Curve 1 in Fig. 5.36 is the result of an experiment conducted on a
test specimen DN800 made of steel 22K.
Figure 5.36 shows the satisfactory agreement between the calculated
and experimental curves. The observed discrepancy in the curves for the
number of inspections
k
> 6 is of fundamental nature. The theoretical curve
2 tends to 0 with the increase in the number of inspections, whereas the
experimental curve tends to 0.05. The value ε = 0.05 is determined by the
limited capacity of the inspection method. If the detection of defects is
described by equation [5.5], setting ε = 0.05, then there is better agreement
between the calculated curve 3 and experimental curves 1 for the number of
inspections
k
> 5. Curve (3) was plotted using the modified equation [5.18]:
(
)
[
]
N N
=
exp
kaa
(
− α −
)
.
[5.19]
+ε
res
in
0
Equation [5.19] holds in the region
ln(1
−ε
)
.
aa
≥−
[5.20]
0
k
Search WWH ::

Custom Search