Environmental Engineering Reference
In-Depth Information
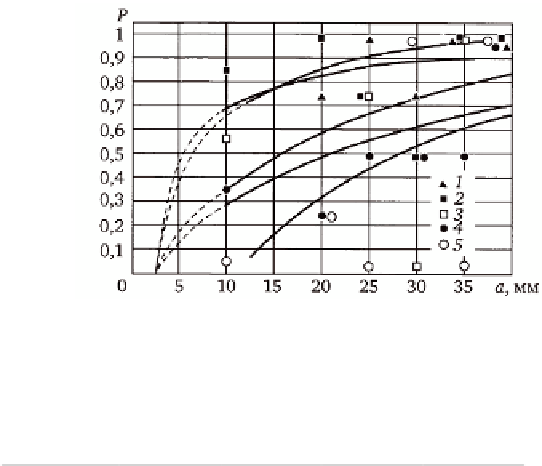
5.17
Dependence of the probability of detecting a defect on
the linear size of defects: 1) automatic ultrasonic inspection; 2)
radiography, 3) ultrasonic inspection, No. 12, 4) ultrasonic inspection,
No. 11, 5) ultrasonic inspection, No. 18.
Table 5.6
Probability of detection of defects of different length
Length, mm
Methods
From 15
to 20
From 20
to 25
From 25
to 30
From 30
to 35
From 35
to 40
To 15
Radiography
0.86
1
0.75
0.5
1
1
Automatic
ultrasonic
0.84
0.75
1
0.75
1
1
Ultrasonic,
No. 12
0.58
0.5
0.75
0
1
1
Ultrasonic,
No. 18
0.04
0.25
0
1
0
1
Ultrasonic,
No. 11
0.37
0.25
0.5
0.5
0.5
1
Curve Σ (see Fig. 5.7) reflects the total result of inspection carried out
by four NDT inspectors. It is seen that the curve Σ lies significantly below
each of the curves obtained by NDT inspectors
X
1
-
X
4
. This means that the
defectiveness of the component can be reduced by a factor of 2 or more
only by organisation of repeated inspection by different NDT inspectors.
Figure 5.18 shows that the effective number of inspections is
6. Subsequent inspections (7
th
-10
th
) do not lead to any further detection of
defects in the inspected sample (in this case, pipes 800 mm in diameter,
made of steel 22K representing the model of the main circulation line of the
RBMK reactor were inspected). Each inspection was performed by manual
ultrasonic testing by different NDT inspectors. Curve 2 in Fig. 5.18 reflects
the individual results of each NDT inspector.


Search WWH ::

Custom Search