Geoscience Reference
In-Depth Information
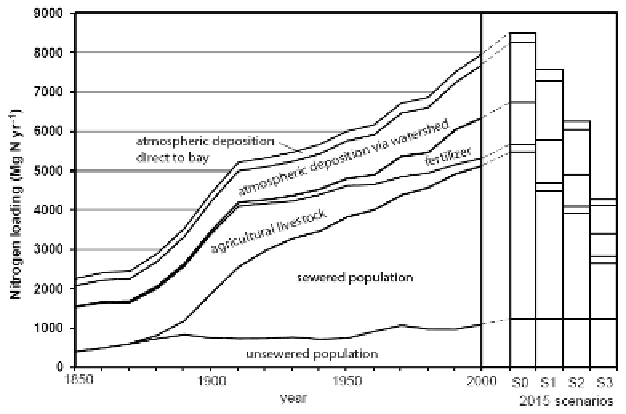
FIGURE 2-2
Narragansett Bay nitrogen loading from 1850 to 2015 under several
different scenarios. Scenario 0 (S0), current conditions and no improvements in
wastewater treatment; scenario 1 (S1), current conditions and implementation of all
mandated reductions in nutrient from wastewater-treatment plants; scenario 2 (S2), all
wastewater treatment plants have a maximum effluent nitrogen of 8 mg/L in summer,
25% reduction in nitrogen air-pollution concentrations, and 25% reduction in fertilizer
use in the watershed; scenario 3 (S3), all wastewater-treatment plants have a maximum
effluent nitrogen concentration of 3mg/L in summer, 50% reduction in nitrogen air-
pollution concetrations, and 50% reduction in fertilizer use in the watershed. Source:
Vadeboncouer et al. 2010. Reprinted with permission; copyright 2010,
Estuaries and
Coasts
.
Shifting Spatial and Temporal Scales
In the early days of environmental remediation and pollution control, the
problems were more obvious. One could see, indeed often even smell or taste,
the pollutants, and local causes could be easily identified. As progress has been
made in cleaning up the local problems and as more has been learned about the
health and environmental consequences of chronic low-dose exposures to di-
verse chemicals, much of the focus has moved to wider geographic areas. The
spatial scales required to understand emerging environmental issues vary widely
and are increasing as more is learned about the systems underlying the observed
phenomena.
Acid rain and photochemical air pollution are regional problems, and
monitoring, modeling, and control activities have shifted accordingly. EPA's
long-standing involvement in regional-scale air quality monitoring and modeling
research includes the multi-agency National Acid Precipitation Assessment Pro-
gram (NAPAP 1991), which was authorized by Congress in 1980 and informed
Search WWH ::

Custom Search