Biology Reference
In-Depth Information
2:2:1
2:2:2
4400
4800
5200
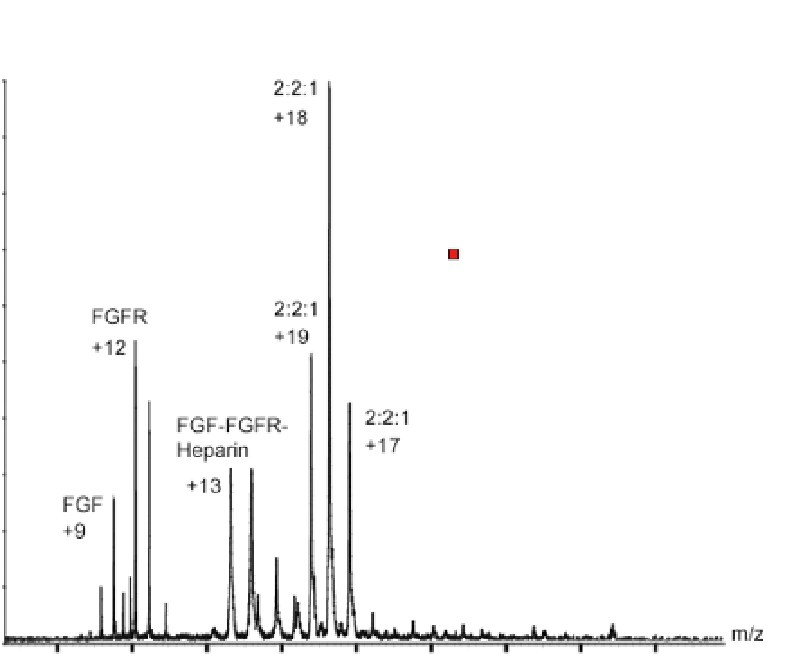
Fig. 4.
The FGF:FGFR:heparin complex exhibits a 2:2:1 stoichiometry. The MS spectrum
clearly demonstrates that the stoichiometry of this complex is the 2:2:1 with simulations
(sharp red and blue peaks in inset) clearly showing the correspondence of the 2:2:1 (blue)
theoretical spectrum with the onset of the measured peaks. Broad peaks are typically
observed for non-covalent complexes because buffer molecules and other adducts remain
bound to the complex. Charge states are indicated for the different molecular species.
confirmation of this was established by employing tandem MS experiments
where ions corresponding to the intact complex were isolated and dissoci-
ated in the collision cell of the spectrometer and the products analyzed. The
dissociation products indeed show only one bound heparin molecule.
RNA polymerase
It should be noted that broadening of peaks is characteristic of non-covalent
complexes because buffer molecules and some adducts are often retained.


Search WWH ::

Custom Search