Biology Reference
In-Depth Information
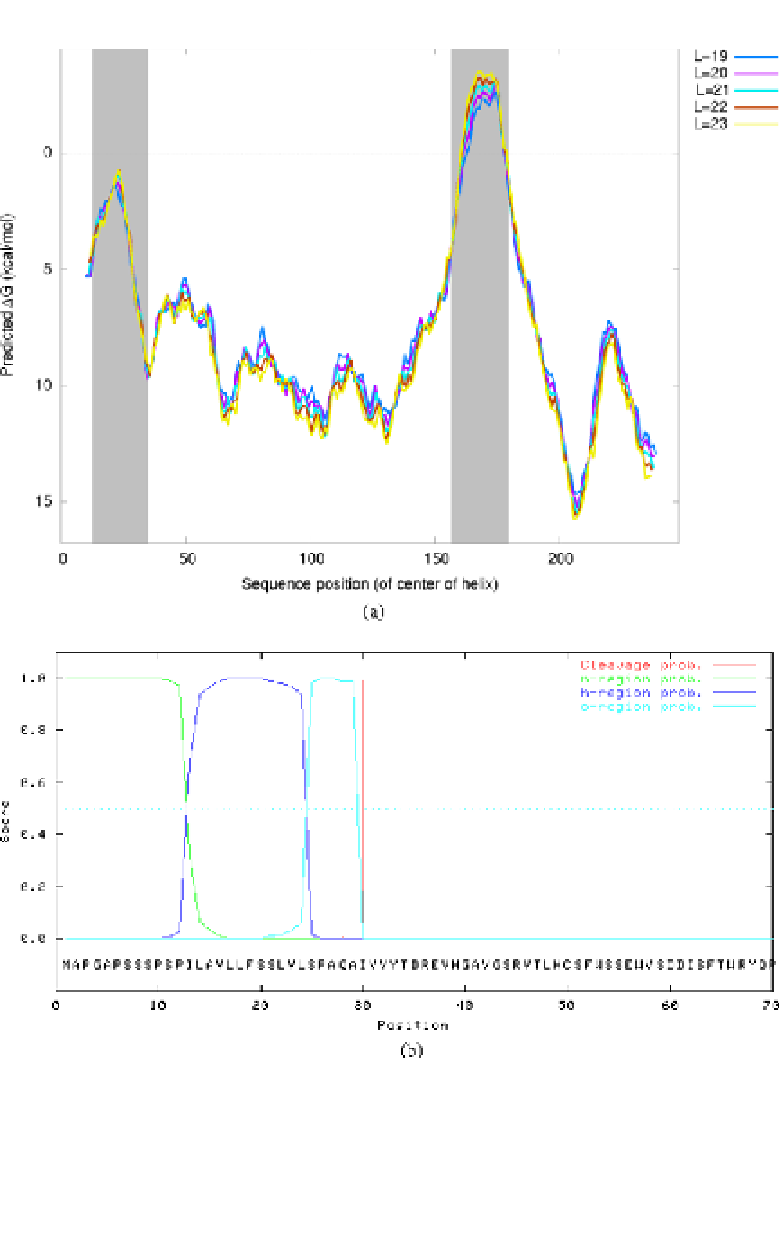
Fig. 3.
Analysis of the human P0 by (a) the ∆
G
app
predictor and (b) SignalP 3.0. Putative
transmembrane segments are shaded in the ∆
G
app
plot. The predicted N-terminus of the
mature protein after signal peptidase cleavage is indicated by a red line in the SignalP plot.
The n-, h- and c-regions in the predicted signal peptide are shown in green, blue and sky
blue respectively.


Search WWH ::

Custom Search