Biology Reference
In-Depth Information
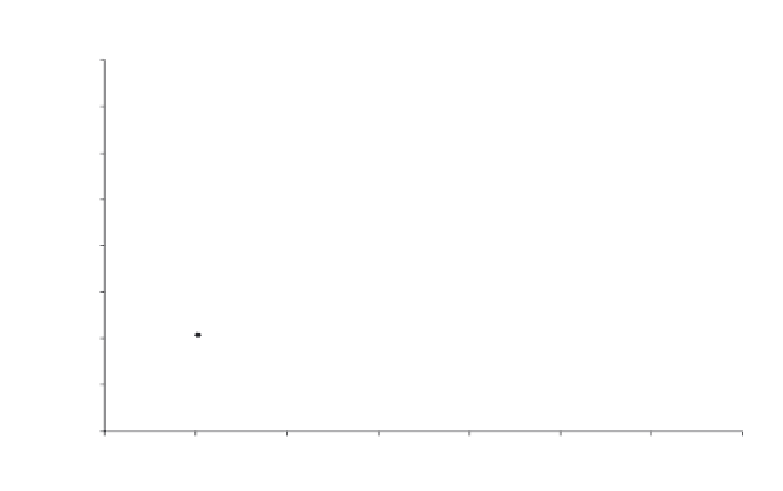
0.40
0.35
R
2
= 0,99
0.30
0.99
0.25
0.20
0.15
0.10
0.05
0
0
100
200
300
400
500
600
700
Albumin
Fig. 7.
Standard curve for the determination of the concentration of human albumin in a
sample (in this case CSF and plasma). The sample cuvette contained stained, artificial gel
antibodies selective for human albumin, prepared as described in Ghazemzadeh
et al
.
(2008) The reference cuvette contained a suspension of albumin-selective, stained gel
granules depleted of albumin (control gel).
albumin may be affected in ALS and perhaps also for other proteins. In
contrast, a low level of albumin was observed in plasma from ALS
patients compared to the control plasma samples (Fig. 8(b)). The results
further indicate that our approach might also apply well to other bio-
markers for the actual neurological disease and other disorders.
Selectivity,protein capacity and imprinting
of bioparticles
A comparison between the chromatograms in Figs. 4(a) and 4(b) (obtained
from analyses with a cation exchanger of the eluate from the “blank
column” and the “horse myoglobin” column, respectively) shows that
only horse myoglobin was adsorbed onto the latter column but none of the
other proteins, not even whale myoglobin, although the amino acid
sequence of the two myoglobins differs in only twenty of the 153 amino
acid positions and in such a way that the three-dimensional structure is


Search WWH ::

Custom Search