Biology Reference
In-Depth Information
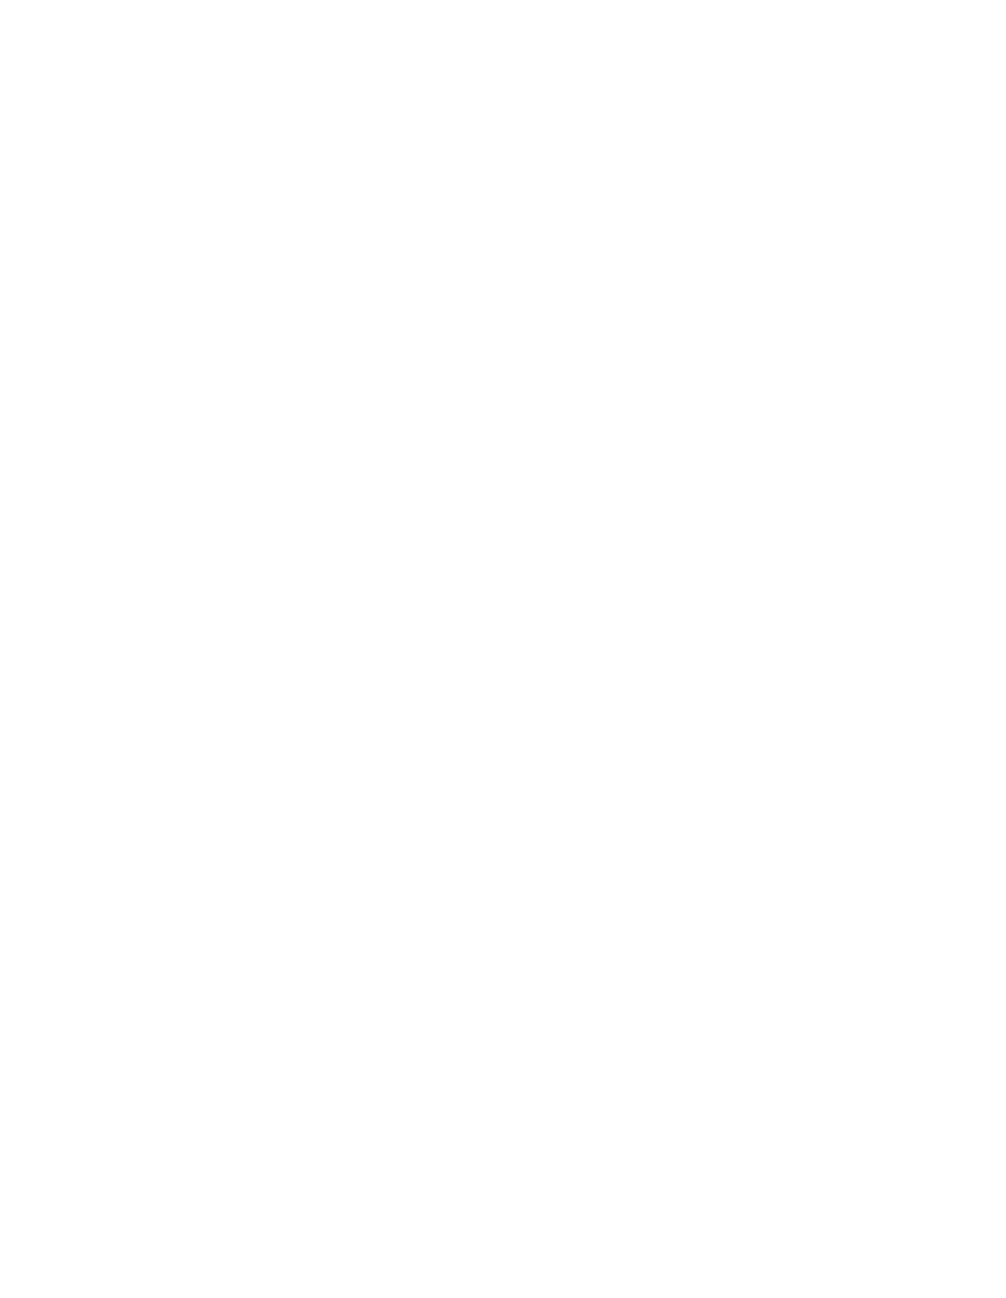
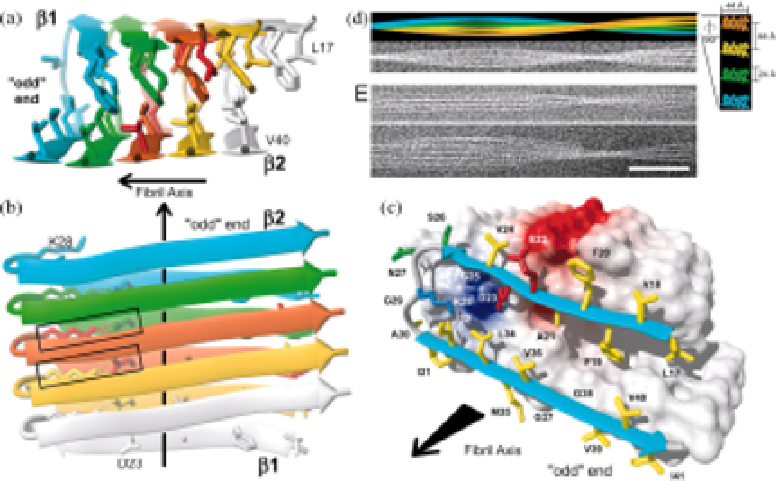
Fig. 3.
The structure of an Aβ 1-42 fibril. (a) and (b), Ribbon diagrams of the core struc-
ture of Aβ17-42. The β-strands are indicated by arrows, and intermolecular salt bridges
are represented by dotted lines. The salt bridges formed by the central (orange) Aβ mole-
cule are highlighted by boxes. (c) Van der Waals contact surface polarity/ribbon diagram.
Color code for the residues: yellow = hydrophobic, green = polar, red = negatively charged,
blue = positively charged. (d) Simulation of a fibril containing four protofilaments.
(e) Cryo-EM of Aβ1-42 fibrils. Scale bar = 50 nm. From Lührs (2005).
Other Techniques
Several other techniques besides SS-NMR have been used for studying
fibrils. Electron spin resonance was used for studying spin-labeled A
1-40
fibrils, and the results were in line with those from SS-NMR, supporting
the presence of an unstructured N-terminus followed by a parallel in-reg-
ister
β
-sheet region interrupted by a loop region around residues 23-26.
Hydrogen exchange and limited proteolysis are other approaches that
have been used to elucidate the structure of A
β
in fibrils. Proteolytic
enzymes cannot degrade compact and rigid structure such as
β
-sheets, and
thus, only the unstructured part of a fibril will be degraded by proteases.
By using trypsin (which cleaves peptide bonds after Lys or Arg) and
β

Search WWH ::

Custom Search