Biology Reference
In-Depth Information
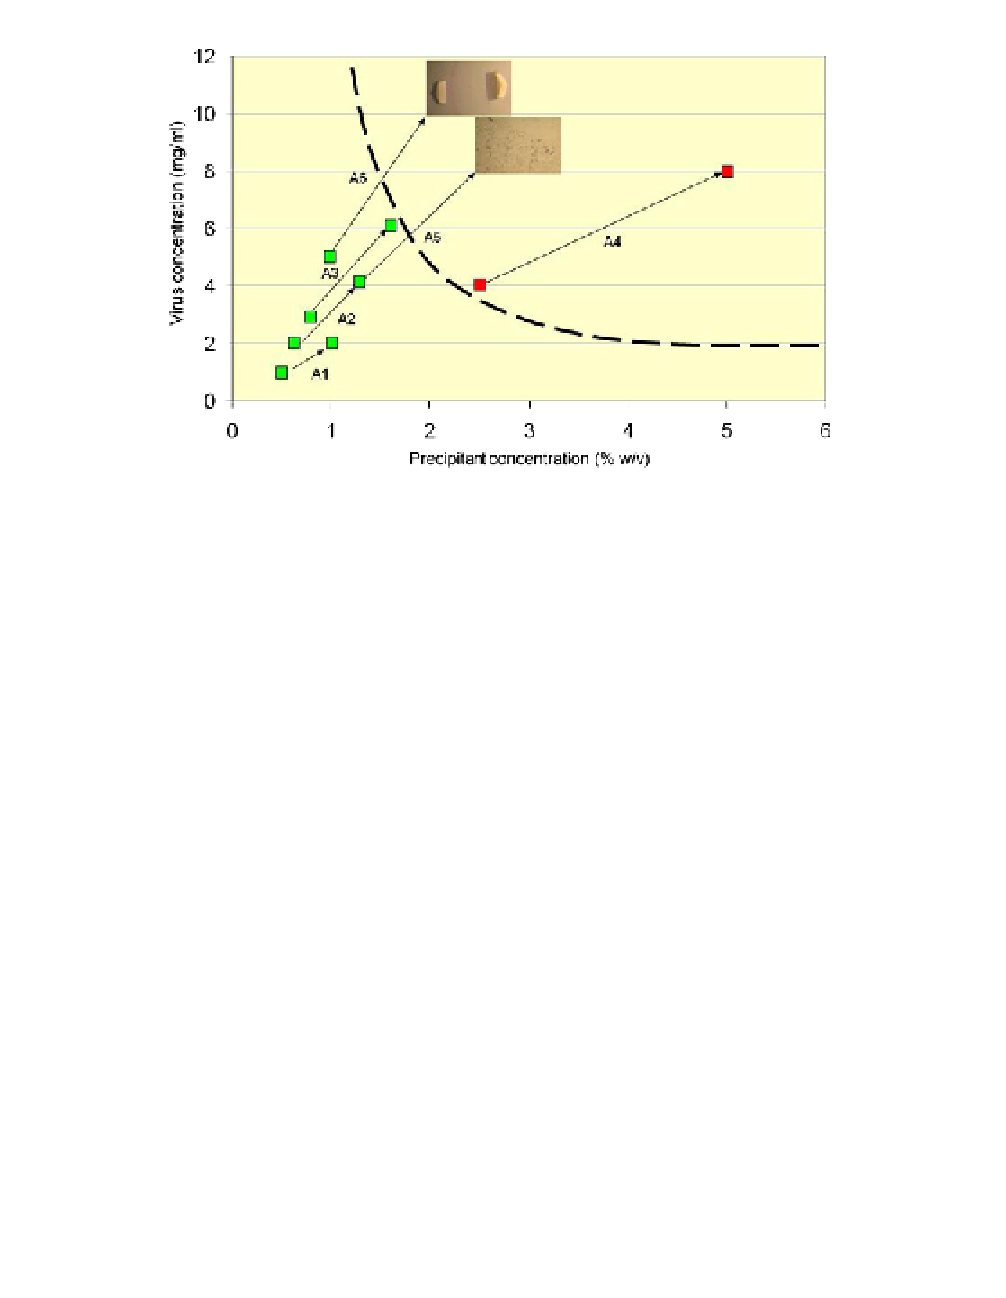
Fig. 1.
Precipitation diagram after performing only five crystallization trials (A1-A5).
The additional experiment, A6, resulted in single crystals and was performed after ana-
lyzing experiments A1-A5. Each experiment describes the conditions at the beginning of
the experiment and again after two months. Red squares mean that precipitate had devel-
oped; green squares mean that the drop was clear, without detectable precipitate.
Experiment A5 resulted in microcrystals, but A6 resulted in large single crystals (0.2 mm).
The boundary between undersaturation and oversaturation is calculated using
c
*(virus) ×
c
(precipitant) = 9.6 [
c
*(virus) — concentration of virus in supersaturation]. Crystals (drop
A5 and A6) were obtained after setting up the crystallization trials as described in Table 1
and according to the equation
c
(virus) ×
c
(precipitant) = 20 [8 (mg/ml) × 2.25 (% w/v) =
20]. Assuming that the relationship
c
(virus) ×
c
(protein) = 20 was valid, the next drop was
set up with a concentration of 10 mg/ml of virus and 2% (w/v) concentration of precipi-
tant so that
c
(virus) ×
c
(precipitant) still equals 20. How to plot the precipitation diagram
is described in detail for membrane proteins in Sedzik
et al
. (2001, 2003), and Sedzik
(2004).
when crystallizing viruses or proteins. The pH was the same as that in
which the virus particles were purified.
It this short chapter, it is shown that — when searching for initial crys-
tallization conditions — it is very beneficial to simultaneously vary the
protein concentration and the concentration of the precipitant. From Table 1
and Fig. 1 it is evident that from each of the experiments performed, two very
important pieces of information are available: namely, what occurred in
the drop at the beginning of the experiment and the result after 1-3 months.

Search WWH ::

Custom Search