Biology Reference
In-Depth Information
Modes of generation of supersaturation:
cooling
evaporation
drowning-out
reaction
C
Supersaturated
Evaporation
B
A
Cooling
Solubility
curve
Undersaturated
Temperature
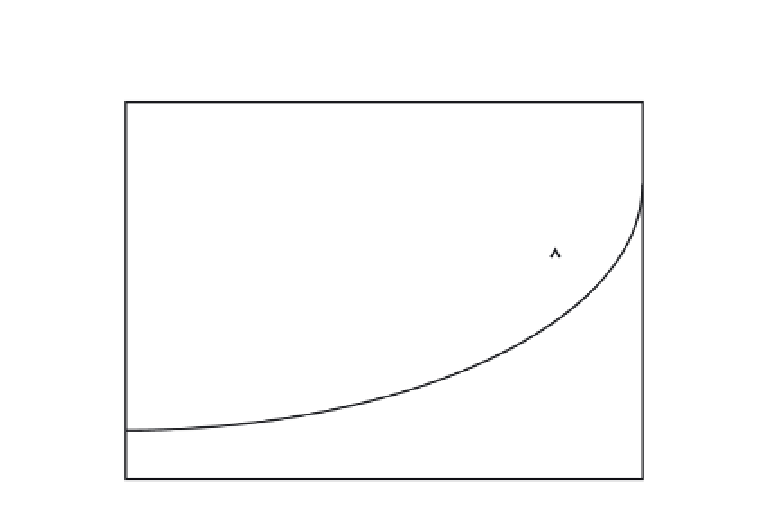
Fig. 1.
Schematic description of change in the solution conditions at different modes of
generation of supersaturation. The diagram shows solute concentration in the solution, e.g.
in units of [kg solute/kg solvent], versus solution temperature in degrees centigrade or
Kelvin. Depending on the compound and the process, the temperature range covered in a
cooling crystallization is typically 10-40°C. Supersaturation and undersaturation can be
described, e.g. by ∆
c
=
c
−
c
* [kg/kg solvent], where
c
is the concentration and
c
* is the
solubility. The arrows describe how the solution conditions change at cooling and evapo-
ration, respectively.
the solubility curve, either by moving the state of the solution or by moving
the corresponding solubility. In principle, there are four ways of accom-
plishing this. If the solution is cooled, the state of the solution is moved from
point A horizontally towards point B. After passing the solid solubility line,
the solution is supersaturated. On the other hand, if the solvent is evapo-
rated, the concentration is increased, and the state of the system is moved
vertically upwards from point A towards point C.
An alternative is to add another soluble substance or solvent, which
lowers the solubility of the substance to be crystallized, i.e. in principle
moving the solubility curve so that point A ends up being above it. Finally,
in a reaction crystallization, the substance is formed by a chemical reac-
tion in concentrations exceeding the solubility.


Search WWH ::

Custom Search