Environmental Engineering Reference
In-Depth Information
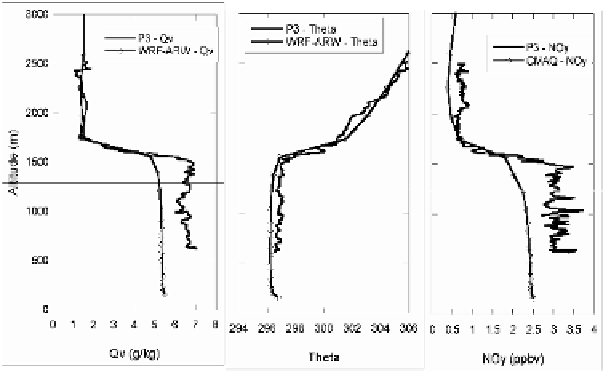
measurements gave valuable evidence of the vertical structure of meteorological
and chemical parameters within and above the PBL.
Figure 2
shows an example of
vertical profiles for potential temperature, water vapor mixing ratio, and NO
y
for a
P3 spiral about 120 km SE of Dallas at 19 UTC on 9/25/2006 compared to the
model simulations from the WRF-CMAQ system. Although the NO
y
concentration
and water vapor mixing ratio are underpredicted in the PBL, the PBL structure is
quite accurate for both meteorological and chemical parameters.
Fig. 2.
Modeled and observed profiles from P3 spiral at 19 UTC on 9/25/2006
5. Next Steps
New CMAQ runs that include the special Texas emissions inventory and a 4 km
horizontal nested grid domain centered on Houston are underway. Meteorology
and chemistry model results will be compared to all of the P3 flight measurements
with particular emphasis on the vertical spirals. Balloon data and aircraft lidar data
will also be used to evaluate the vertical structure of meteorological and chemical
fields
.
Dislaimer
Although this paper has been reviewed by EPA and approved for publication, it does
not necessarily reflect EPA's policies or views.
References
Bianco, L., J. M. Wilczak, and A. B. White, 2008, Convective Boundary Layer Depth estimation
from wind profilers: Statistical comparison between an automated algorithm and expert
estimations, J. Atmos. Occean. Tech., 25, 1397-1413.