Environmental Engineering Reference
In-Depth Information
of about 0.5-1.0 ms
−1
is evident over the entire domain where the extra forcing
was applied. A corresponding significant increase of the TKE production is
observed in the first three computational levels. A detailed discussion of the
coupled model performance can be found in Tsegas et al. (2008).
k
m
2
/s
2
0.2 0.4 0.6 0.8 1.0 1.2 1.4 1.6 1.8 2.0 2.2 2.4 2.6 2.8 3.0 3.2 3.4
1.5
1.2
0.9
0.6
0.3
600
400
0.0 m/s
-0.3
-0.6
-0.9
-1.2
-1.5
200
0
0
-200
200
x (m)
3.0
2.7
2.4
2.1
1.8
1.5 m
2
/s
2
1.2
0.9
0.6
0.3
0.0
(a)
(b)
(c)
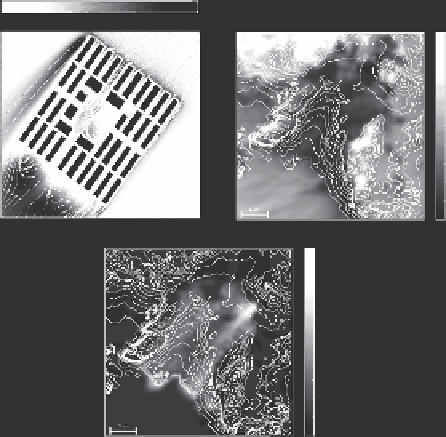
Fig. 1.
Numerically predicted flow field and TKE (a) calculated for the Patision microscale
domain for 08/05/2002:11:00 LST, and difference maps of the calculated wind velocities (b) and
TKE (c) for the Athens mesoscale case
As a benchmark of the performance of the metamodels under study, their
response was observed while the input state was linearly varied from the cali-
bration state (1) (minimum inflow angle) to calibration case (3) (maximum inflow
angle) for the Patision domain. As evident from the response curves in
Fig. 2a,
the
RBF metamodel not only approximates the two intermediate calibration points
better than ISD but effectively provides a better interpretation of the physical
model's behaviour throughout the input range. The angular response calculated for
an input vertical profile (dotted black line), obtained by averaging the MIMO
inflow profiles of cases (1) and (3) for the Patision domain, is shown in
Fig. 2b.
The corresponding output profiles produced by RBF and ISD are indicated by
solid black and violet lines. The superior performance of the RBF metamodel is
indicated by the obvious similarity of its lower-level response (up to the average
building height of ~20 m) with the one calculated by MIMO for the nearby profile
(3) (red). Moreover, the deflection of the outgoing flow towards 190°, which is the
principal direction of street canyons in the Patision domain, is better approximated.

