Environmental Engineering Reference
In-Depth Information
3. Results
Figure 2
compares barrier and non-barrier normalized tracer concentrations for a
15-min period in neutral conditions.
Figure 3
is a contour map of the ratio between
barrier and non-barrier concentrations at corresponding grid locations for the same
neutral case. The barrier had the effect of reducing downwind concentrations by
more than 50%. This pattern was repeated consistently in all stability conditions.
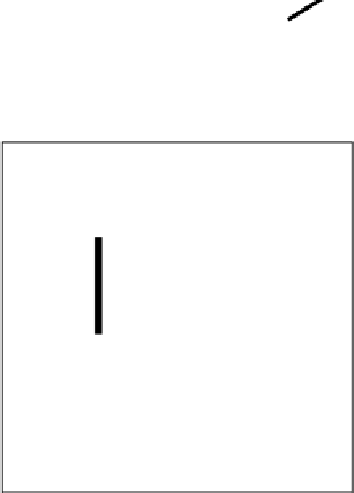
Fig. 2.
Corresponding non-barrier (left) and barrier (right) normalized concentration/wind vector
maps for an example neutral stability case. The tracer release line is indicated in bright red; the
barrier in bold black
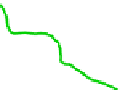
Fig. 3.
Contour map of the ratio between barrier and non-barrier concentrations at corresponding
grid locations for the neutral stability case shown in Fig. 2