Environmental Engineering Reference
In-Depth Information
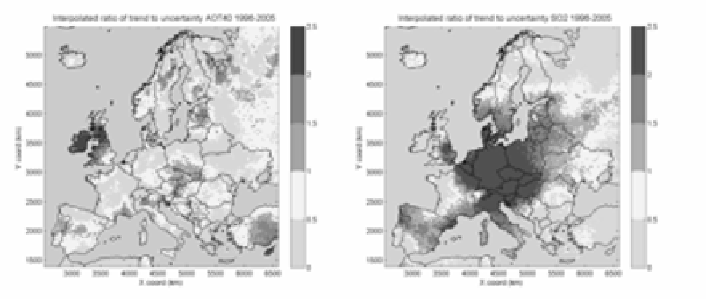
There are few areas in the AOT40 trend maps with trends greater than their
estimated uncertainty. There are large areas in the SO
2
trend maps with negative
trends greater than their estimated uncertainty.
Fig. 3.
Maps showing the ratio of the absolute trend to the standard deviation of the trend for
AOT40 (left) and annual mean SO
2
(right) for the years 1996-2005. The standard deviation of
the trend is calculated using Monte Carlo methods
Acknowledgments
This work was carried out by the European Topic Centre on Air and Climate
Change on behalf of the European Environment Agency.
References
AirBase (2008), European air quality database
. http://airbase.ionet.europa.eu/
Denby, B., I. Sundvor P. de Smet, and F. de Leeuw (2008a)
Preliminary assessment report on the
spatial mapping of air quality trends for Europe. ETC/ACC Technical Paper 2008/3.
http://air-climate.eionet.europa.eu/reports/ETCACC_TP_2008_3_spatial_trends_scoping
Denby B., M. Schaap, A. Segers, P. Builtjes and J. Horálek
(2008b). Comparison of two data
assimilation methods for assessing PM10 exceedances on the European scale. Atmos.
Environ. 42, 7122-7134.
(2007) Spatial mapping of air quality for European scale assessment. ETC/ACC Technical
Paper 2006/6. http://air-climate.eionet.europa.eu/reports/ETCACC_TechnPaper_2006_6_Spat_
AQ
Sen, P. K. (1968), 'E
stimates of the regression coefficient based on Kendall's tau', J. American
Statist. Assoc. 63, 1379-1389.
Solberg S., J. Horalek, J. E. Jonson, S. Larssen, F. de Leeuw (2009).
Assessment of ground-level
ozone within the EEA Member Countries with focus on long-term trends. First draft of an
ETC/ACC technical report, in preparation.