Environmental Engineering Reference
In-Depth Information
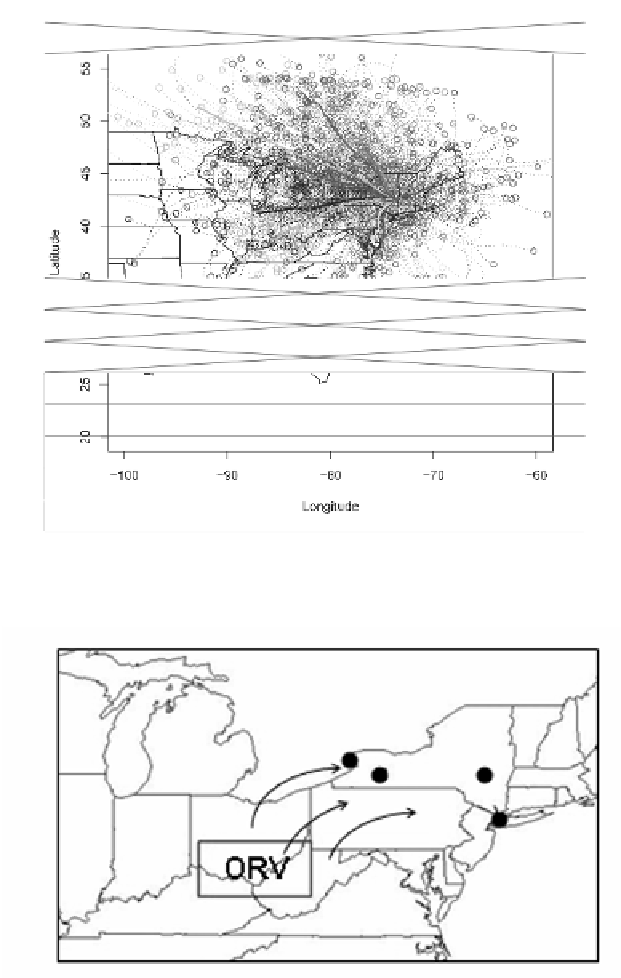
Fig. 1.
Example of back-trajectories performed for selected sites (Albany, NY shown here) for
summers of 1999-2006 (dashed lines), clustered into 12 major meteorological patterns (solid lines)
Fig. 2.
Rectangle shows Ohio River Valley as defined for this study. Arrows indicate wind
direction for downwind sites. From left to right, circles represent approximate location of
Buffalo, the southwestern site, Albany and NYC
the NOx SIP Call versus after the implementation of the NOx SIP Call. Further-
more, there were fewer extreme ozone events after the implementation of the NOx
SIP Call as compared to before the implementation of the NOx SIP Call,