Environmental Engineering Reference
In-Depth Information
therein). Spatial variations in NO
x
and isoprene-emitting vegetation will influence
the local sensitivity of O
3
to temperature (and other meteorological variables
such as humidity), as has been shown to occur within broad U.S. regions (e.g., Lin
et al., 2001; Camalier et al., 2007) and on more local scales (e.g., Steiner et al.,
2006).
To our knowledge, the ability of global chemistry-climate models to reproduce
observed correlations between temperature (or any meteorological index) and air
temperature correlations at four U.S. sites, identified as “regionally representative”
on the basis of seasonal variations in surface O
3
(Reidmiller et al., 2009). We
suggest that the regional variations in slope reflect differences in the processes
contributing to the O
3
-temperature relationship and that these types of relation-
ships should be used to evaluate chemistry-climate models. A second test would
be to examine how well models capture the relationship between a decreasing
frequency of migratory cyclones and increasing high-O
3
events, as determined
from a recent observational analysis for the northeastern U.S. (Leibensperger
et al., 2008). The decreasing frequency of cyclones in this region is associated
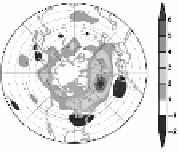
with a northward shift in storm tracks (
Fig. 7),
a robust feature across climate
models forced with increasing greenhouse gases (Christenson et al., 2007).
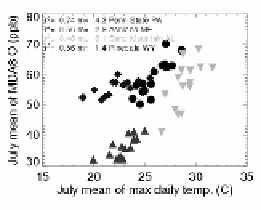
Fig. 6.
Regional variability in the relationship between July mean daily maximum 8-h average
(MDA8) O
3
(ppb) vs. July mean daily max temperature (°C) from 1989 to 2004 at selected U.S.
CASTNet sites in the northeast (Penn State, PA), far northeast (Ashland, ME), southeast (Sand
Mountain, AL), and western (Pinedale, WY) U.S.
Fig. 7.
Poleward shift in northern hemisphere summertime storm tracks in the GFDL CM2.1
climate model (Delworth et al., 2006), diagnosed from differencing the root mean square of 2-10
day bandpass filtered 500 hPa geopotential heights (m) between 100-year simulations corres-
ponding to a pre-industrial control experiment and a 1% year
−1
CO
2
increase to doubling