Environmental Engineering Reference
In-Depth Information
EMEP database and for the rest of the domain (Africa, Arabian Peninsula, etc.) the
anthropogenic emissions are from the Global Emission Inventory database GEIA.
An algorithm was developed for the gridding of the emissions, using an appropriate
interpolation technique in order to combine all the mentioned inventories. The
simulation period is 1-30 August 2005, with a horizontal resolution of 0.24° ×
0.24° for the SKIRON/Dust and 0.5° × 0.25° for the CAMx model.
3. Aerosol Chemical Composition: Discussion
Emphasis is given to desert dust, sea salt, nitrates and sulfates. The aerosols enter
the domain during the 30 days of the simulation, following different paths and
having highly variable concentrations depending on the distance from the sources.
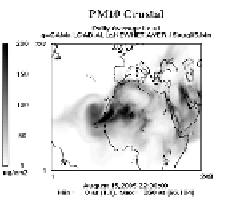
Aerosols transported to the Central Atlantic Ocean from the African Continent and
the Mediterranean Sea during summer are mostly of primary nature and third
generation pollutants (
Fig. 1a-d).
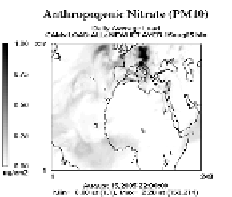
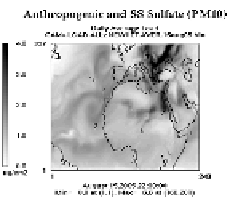
Furthermore, anthropogenic aerosols in the form
of sulfates and nitrates are significant in the area while their concentrations are
highest in the European Region
(Fig. 1e, f).
a
b
c
d
e
f
2
Fig. 1.
Daily average load of anthropogenic and natural aerosols (μg/cm
) after 15 days of
simulation with the CAMx model
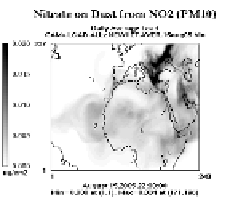
The third generation aerosols, which come from the combination of anthropogenic
gases (HNO
3
, NO
2
, SO
2
) and natural particles (dust), are traveling towards the
Central Atlantic as well as Eastern Europe and the Mediterranean
(Fig. 1b-d)
. In
the case of nitrate formation on the dust surface, the comparison between observations
and model results indicates an improvement of the model performance. As indicated
in
Fig. 2,
anthropogenic nitrate compared to the observations (denoted as
PNO3
,
blue line) has a rather poor correlation. When introducing the nitrate on dust
(denoted as
DNO3
, green line) the correlation is better and so is the comparison