Environmental Engineering Reference
In-Depth Information
grid for CAMx. Initial and boundary conditions are taken from 50 km resolution
run for whole Europe by Krueger et al. (2008) or Katragkou et al. (2009). In our
setting CB-IV chemistry mechanism is used (Gery et al., 1989). As the first step,
the distribution of pollutants is simulated off-line for time slice of 10 years, period
of 1991-2000 driven by reanalysis ERA40 is used for validation of the model run
against the observation from selected stations.
Example of monthly average ozone concentration comparison is presented in
Fig. 1 i
n terms of Taylor diagram with sensitivity test to precipitation bug. Reasonable
agreement can be seen, but deeper insight into the behaviour of the outputs can be
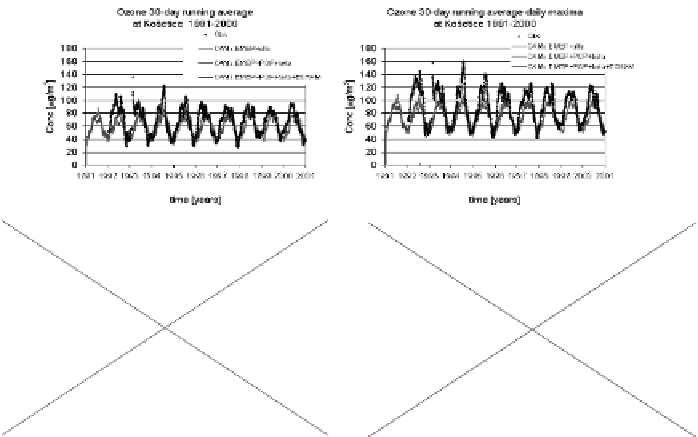
seen from time series of the ozone concentration presented in
Fig. 2. C
learly, even
0
Correlation Coefficient
0.2
CH04
0.4
CH03
IT04
0.6
DE07
DE02
DE08
0.8
AT30
AT02
0.9
0.95
SK04
CZ03
CZ01
0.99
0.9 0.75
0.6
0.5
0.3 0.05
0.75
1
0
0.38
1.1
1.5
Standard Deviation
Centered RMS Difference
Fig. 1.
Monthly average of ozone concentration, Taylor diagram of two versions of RegCM
(beta - high resolution precipitation bug corrected) against observations, 1991-2000, ERA40 driven
Fig. 2.
Ozone characteristics from different model versions compared to observation at station
Kosetice (above) and Illmitz (bottom) for 1991-2000


