Environmental Engineering Reference
In-Depth Information
x10
15
Surface & Satelite NO
2
Day of Week Profiles
18
16
14
12
10
8
6
4
2
0
Sun
South Coast
San Francisco
San Joaquin Vallery
OMI
CARB
-20
-15
-10
-5
0
Mon
Tue
Wed
Thu
Fri
Sat
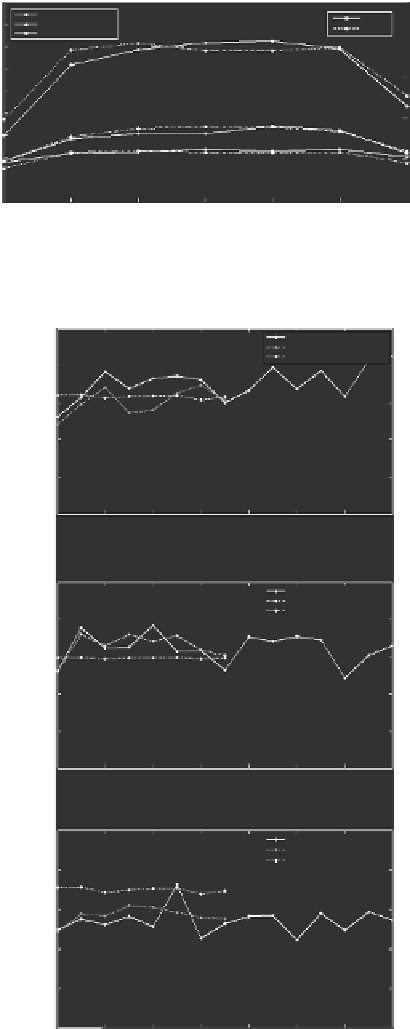
Fig. 3.
Average day of week NO
2
profiles from OMI (solid) and CARB monitoring sites
(dashed) for summer 2005-2007 in the South Coast, San Francisco Bay Area, and San Joaquin
Valley air basins of California
South Coast Air Basin
2.5
OMI
CARB surface sites
CARB emission estimate
2
1.5
1
0.5
0
Win 05
Sum 05
Win 06
Sum06
Win 07
Sum 07
Win 08
Sum 08
San Francisco Bay Area Air Basin
2.5
OMI
CARB surface sites
CARB emission estimate
2
1.5
1
0.5
0
Win 05
Sum 05
Win 06
Sum 06
Win 07
Sum 07
Win 08
Sum 08
San Joaquin Valley Air Basin
OMI
CARB surface sites
CARB emission estimate
2.5
2
1.5
1
0.5
0
Win 05
Sum 05
Win 06
Sum 06
Win 07
Sum 07
Win 08
Sum 08
Fig. 4.
The ratio of weekday to weekend NO
2
concentrations from OMI, CARB ground
monitoring sites, and CARB emission estimates for (a) the South Coast, (b) the San Francisco
Bay Area, and (c) the San Joaquin Valley air basins