Environmental Engineering Reference
In-Depth Information
Season : SUMMER [03] (2041
-
2050)
−
(1991
-
2000)
Season : SUMMER [SOLRAD] (2041
-
2050)
−
(1991
-
2000)
-10
0
10
20
3
0
-10
0
10
20
30
a
2.0
b
1.6
1.2
0.8
0.4
150
120
90
60
30
0.0
0
-
0.4
-
0.8
-
1.2
-
1.6
-2.0
-30
-60
-90
-120
-150
-10
30
0
10
20
-10
0
10
20
30
Season : SUMMER [CLWP] (2041
-
20
5
0)
−
(
1991
-
200
0
)
Season : SUMMER [TEMP] (2041
-
2050)
−
(1991
-
2000)
-10
0
10
20
30
-10
0
10
20
30
c
d
3
150
120
90
60
30
2
1
0
0
-30
-60
-90
-120
-150
-1
-2
-3
-10
-10
30
0
10
20
30
0
10
20
Season : SUMMER [BIOG] (2041
-
2050)
−
(1991
-
2000)
Season : SUMMER [GEOP] (2041
-
2050)
−
(1991
-
2000)
-
10
-
10
0
10
20
30
0
10
2
0
30
f
e
3500
100
80
60
40
20
2625
1750
875
0
0
-20
-40
-60
-80
-100
-875
-1750
-2625
-3500
-10
0
10
20
30
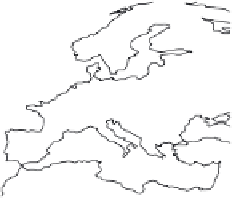
Fig. 1.
All panels show averaged differences between the future (2041-2050) and present decade
(1991-2000) corresponding to the summer season.
(a) Differences of average surface ozone
(b) Differences of average incoming solar radiation
(c) Differences of average cloud liquid water path
(d) Differences of average surface temperature
(e) Differences of 500 hPa geopotential height
(f) Differences of biogenic emissions
3. Results
Figure 1
shows changes in surface ozone and various meteorological parameters
between the future and the present simulation. The results are averaged over the