Environmental Engineering Reference
In-Depth Information
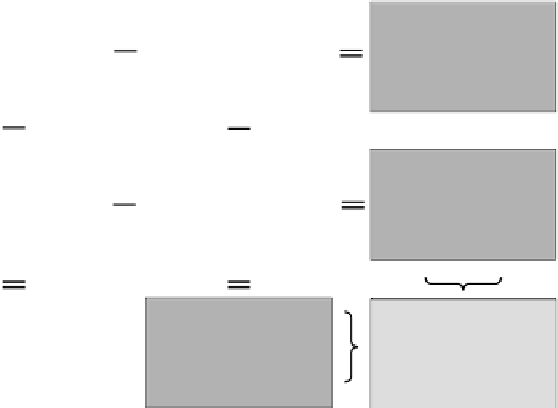
Boxes 7 and 8, the goal for overall system performance improvement would be to
minimise the difference between Boxes 5 and 6 regardless which is higher. Given
that there are factors other than meteorology - most notably the spatial and temporal
emissions distribution - that shape the air quality picture in reality, the Cramer's V
for observation (Box 5) should be less than 1. On the other hand, the modelling
system could be over-idealising the emissions (e.g. fixed in space with only periodic
temporal variations), thus producing a stronger correlation between meteorology
and air quality. The direction for improvement is thus pointed out.
The above comparison of clusters is based on 'free' clustering in that each set
of cluster in Boxes 1-4 is determined independently. However, if the goal is to
diagnose by how much the model deviate from reality, then one should determine
how well the model outputs fit in the clusters defined by observations. This raises
another issue. In 'forcing' the model outputs into the observed clusters, depending
on the shape of data set, the performance statistics could be strongly 'disfavoured'
or 'favoured' by systematic biases for some parameters. In fact, when forcing is
applied to evaluate the modelled meteorology and air quality, the Cramer's V
value increases for the former (0.548 vs. 0.513) and decreases for the latter (0.292
vs. 0.328). But once we have 'forced' the clustering, it also makes sense to correct
for the systematic biases to isolate the residual discrepancy.
Table 1 s
hows model
systematic under-prediction of rainfall and cloud amount. But one can go further
by recognising that there are also cluster-specific systematic biases, e.g. rainfall
under-prediction can range between 12% and 95% depending on the cluster. When
these biases are corrected for in the cluster definitions for forced clustering of the
meteorological data, the Cramer's V are: 0.535 with overall bias correction, and
Weather
Air Quality
Matching
O
B
S
E
R
V
E
D
1. Clusters of
observed
weather
2. Clusters of
observed air
quality
5. Weather and
air quality
match in obs.
M
O
D
E
L
L
E
D
3. Clusters of
modelled
weather
4. Clusters of
modelled air
quality
6. Weather and
air quality
match in mod.
9.
M
A
T
C
H
I
N
G
7. Obs. and
mod. weather
match
8. Obs. and
mod. air quality
match
Match between
obs. Met and
AQ
Match
between mod.
and obs.
Weather
Match
between mod.
and obs. Air
quality
Match
between mod.
Met and AQ
Fig. 1.
Schematic of Analysis Approach