Environmental Engineering Reference
In-Depth Information
140
Case winter 2003: PM10
Measured
Modelled
120
100
80
60
40
20
0
1 3 5 7 9 11 13 15 17 19 21 23 25 27 29 31 33 35 37 39 41 43 45 47 49 51 53
55
57
Day from simulation start (01.02.2003)
Fig. 2.
Predicted PM-10 time series (μg m
−3
) for Melpitz site (Germany), 2003
The spring episode in 2006 started in mid-April when high temperatures over
most of Eastern Europe dried the soil, leading to a significant risk of fires. The
low wind speed resulted in poor ventilation. After a few days of accumulation, a
“cloud” of pollutants about 1,000 km in diameter was blown north-westwards
reaching Iceland and Spitsbergen (
Fig. 3).
The development of this multi-pollution
episode was strongly driven by the meteorology, which synchronised otherwise
uncorrelated phenomena - birch flowering, forest fires, and accumulation of
anthropogenic pollutants.
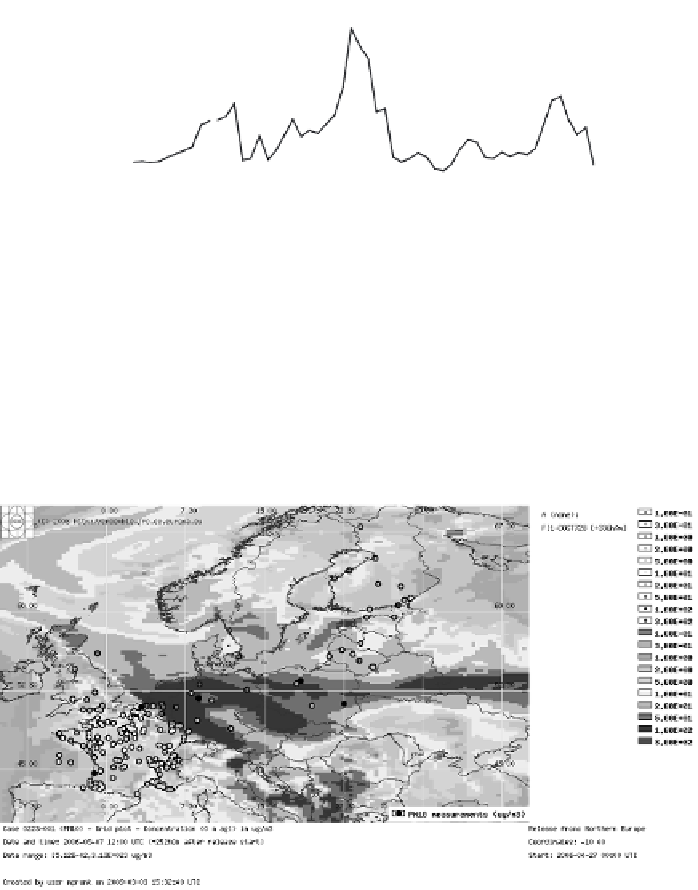
Fig. 3.
Predicted PM-10 pattern (μg m
−3
) for 7.5.2006, 12:00. Observations for the same hour are
plotted on top of the model map using the same color scale
Total aerosol optical depth at 550 nm computed by SILAM was compared with
AOD measured by MODIS The spatial correlation coefficient between SILAM
and MODIS maps computed for each day of the episode ranges from ~0.5 to over
0.7, being highest during days with the highest mean modelled concentrations,
when the wind is blowing from the large emission sources, such as fires in Russia,