Environmental Engineering Reference
In-Depth Information
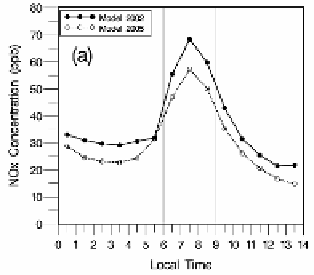
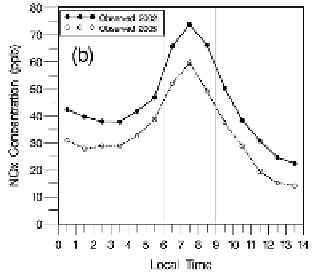
Fig. 2.
Temporal variation of (a) modeled and (b) observed weekday average NO
x
concentrations
at the same location as in Fig. 1
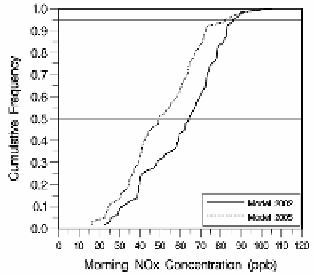
Fig. 3.
Cumulative distributions of modeled morning NO
x
concentrations from summer 2002 and
2005 in the Washington, DC grid cell
results are also in agreement with the overall decline reported in 3-h average
morning observed NO
x
concentrations in this region spanning a more extended set
of years (NESCAUM, 2006). Results based on 34 urban sites reveal the average
changes in modeled and observed weekday morning NO
x
concentrations between
summers 2002 and 2005 were −16% ± 6% and −15% ± 9%, respectively, which
are close to yet slightly less than the mobile NO
x
emissions decline of −17% ± 1%