Environmental Engineering Reference
In-Depth Information
7,000 gm/day. Chlorine emissions of cooling towers in electric utilities are estimated
by multiplying this value to the ratios of water circulating rates. Cooling tower
data for electric utility were obtained from the Environmental Directory of U.S.
Power Plants (Bergesen and Hull, 1996). More than 600 cooling towers are operated
in electric utilities in the U.S. To our knowledge, chlorine emissions from these
cooling towers have not been estimated before.
3. Results and Discussion
Annual HOCl emissions from cooling towers in electric utilities are estimated to
be 4,400 t. This estimate is only a fraction of the 33,000 t of Cl
2
emissions in the
1999 NEI for hazardous air pollutants. The top five ranked states are: Pennsylvania,
Texas, Georgia, Arizona, and Ohio.
A box model containing gas-phase chemical reactions was used to assess the
relative impact of Cl
2
and HOCl on O
3
. The 2005 version of the Carbon Bond
(CB05) chemical mechanism was combined with chlorine chemistry and was used
in the box model (Yarwood et al., 2005). While both Cl
2
and HOCl photolyze to
produce Cl, photolysis rate of Cl
2
is about eight times faster than that of HOCl
(9.0 h
−1
for Cl
2
vs. 1.1 h
−1
for HOCl at typical summer noon). The box model run
was performed with prescribed initial conditions for urban conditions based on
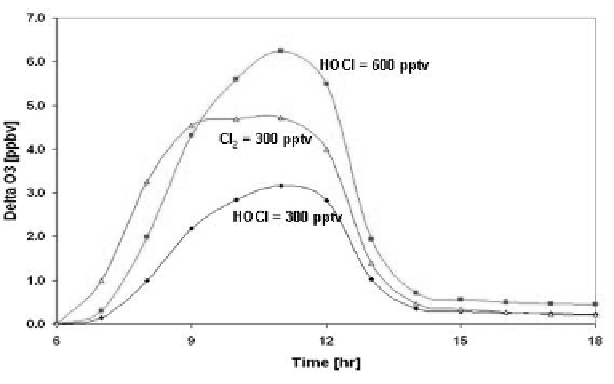
Gao et al. (1996). Model calculations were performed without and with initial
chlorine. Three sets of initial chlorine were examined: 300 pptv of Cl
2
, 300 pptv of
HOCl, and 600 pptv of HOCl. The difference in predicted O
3
with and without
chlorine is presented in
Fig. 1.
When an equal amount of Cl
2
and HOCl is present on a mole basis (300 pptv),
3
the increases in O with Cl are greater than those with HOCl. The rate of increase of
2
Fig. 1.
The relative impact of Cl
2
and HOCl on O
3
in the troposphere