Environmental Engineering Reference
In-Depth Information
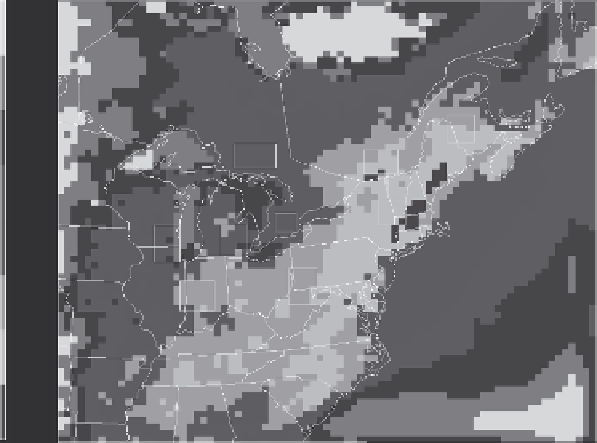
Figure 1 s
hows the average modelled 8 h maximum background ozone con-
centrations across the model domain. Near the boundaries the ground level ozone
concentrations are high because they have not had time to adjust to the balance
between vertical mixing and dry deposition processes which affect the impacts in
the inner part of the model domain. The 5 month average background 8 h maxima
are in the 30-34 ppb range in the inner portion of the model domain. Note that
over large water bodies (such as the Great Lakes) higher background concentrations
are modelled likely because the dry deposition rates are lower over water.
Meteorology can have significant impacts on background concentrations due to
the balance between mixing higher concentrations to ground level and dry deposition
of ozone under different weather conditions. As an example
Fig. 2
shows the
frequency distribution of the background 8 h ozone maxima concentration for
South Western Ontario, Canada (sub region #5 shown in
Fig. 1).
It is a skewed
distribution with the most frequently occurring maxima almost 3 ppb higher than
the average value. The skewed distribution suggests that reducing concentrations
at ground level by dry deposition more frequently dominates over miing higher
concentrations to ground level.
Table 1
summarizes the average and the distri-
butions of the background concentrations for nine sub-domains shown in
Fig. 1.
The modelled highest concentrations and the standard deviations were similar in
all sub-domains (
Fig. 2).
38.000 71
35.500
9
4
7
8
33.000
5
2
3
6
1
30.500
28.000
1
1
79
ppmV
Fig. 1.
Averaged background ozone concentration (ppb) for May-September 2005 and sub-
domains' location