Environmental Engineering Reference
In-Depth Information
4. Results and Discussions
The base case model evaluations for both episodes are within USEPA's recom-
mended statistical limits.
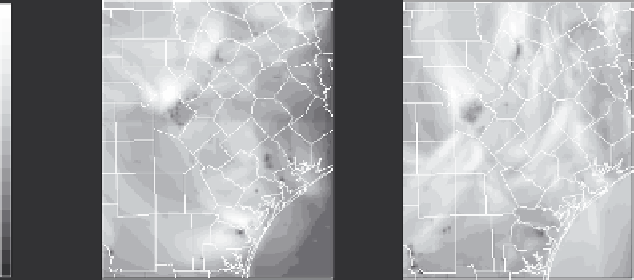
Both episodes display
greater sensitivity to NO
x
emission
reductions with maximum improvement of 9-13% in San Antonio and Austin for
the 1999 episode, while a similar analysis for the 2002 episode demonstrated over
15% improvement using the n50v25 control run (
Fig. 1)
. The maximum impact
from n25v50 reduction simulation is about 3-10% for both episodes in these urban
areas. Corpus Christi exhibits comparable ozone benefit from both NO
x
and VOC
emission reductions.
Max = 15 at (28,72)
Max = 14 at (21,73)
109
109
15
13
11
9
7
6
4
2
-0
-2
-4
Austin
Austin
San Antonio
San Antonio
Victoria
Victoria
Corpus Christi
Corpus Christi
2
2
2
2
%
91
91
91
(a) 1999
(b) 2002
Fig. 1.
Index of Improvement with n50v25 control (a) 1999 episode and (b) 2002 episode
4.1. Impact of zero-out emission control runs on peak concentrations (ppb)
There are marked differences in episode-episode peak reductions with zero out
runs (
Table 1)
. San Antonio and Austin are affected mostly by mobile on-road
emissions with reductions of 15.5 and 9.8 ppb as demonstrated in the 1999
episode and 21.5 and 23.4 ppb respectively for the 2002 episode. The biogenic
VOC emissions have increased by nearly 100 and 133 t in San Antonio and Austin
respectively in 2002. As the on-road mobile emissions in these two areas are
dominated more by NO
x
emissions, peak concentrations also tend to be more sen-
by non-road emissions and Victoria was affected by point sources. Marine emis-
sions in coastal Corpus Christi have reduced in 2002 (Farooqui et al., 2008) and in
Victoria there was a net decline of the total anthropogenic emissions.