Environmental Engineering Reference
In-Depth Information
keq Ha
-1
0.0400
keq Ha
-1
0.5556
0.0320
0.4445
0.0240
0.3334
0.0160
0.2222
0.0080
0.1111
0.0000
0.0000
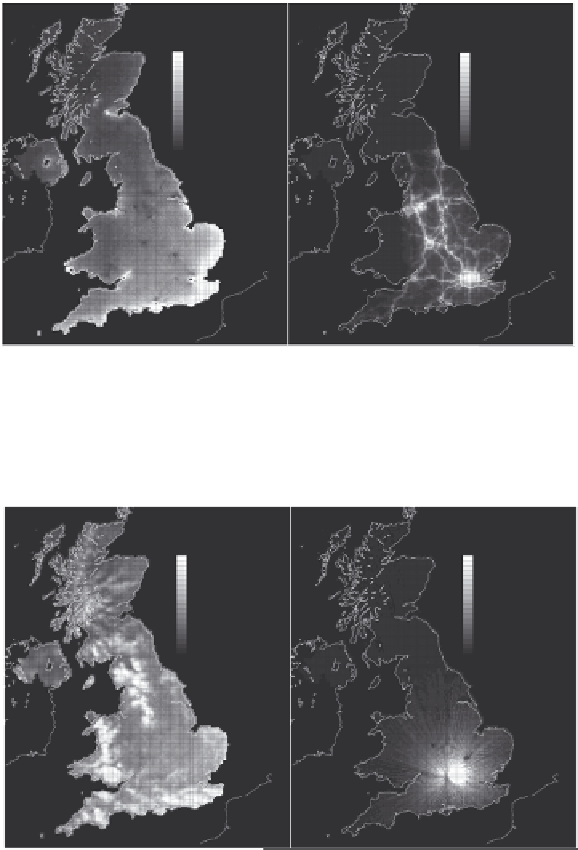
Fig. 1.
Dry Deposition of SO
x
from international international shipping emissions (left); dry
deposition of NO
x
from road transport emissions in England (right)
keq Ha
-1
keq Ha
-1
0.2000
0.0202
0.1600
0.0162
0.1200
0.0121
0.0800
0.0081
0.0400
0.0040
0.0000
0.0000
Fig. 2.
Wet deposition of NO
y
from European emissions (left); dry deposition of SO
2
from a
single power station (right)
References
Dore, A.J., M. Vieno, Y.S. Tang, U. Dragosits, A. Dosio, K.J. Weston and M.A. Sutton (2007)
Modelling the atmospheric transport and deposition of sulphur and nitrogen over the United
Kingdom and assessment of the influence of SO
2
emissions from international shipping.
Atmos. Env.
41
, 2355-2367.