Environmental Engineering Reference
In-Depth Information
At each time step in the simulation, the effects of linear processes, such as
advection and dry deposition, are calculated directly for all tagged species. Poten-
tially non-linear processes, such as gas-phase chemistry, aqueous chemistry, and
particle dynamics are calculated for the overall (base) species and apportioned to
the tagged species. The results for the tagged species are not normalized to ensure
that their sum equals the total. Thus, the difference between the sum of all tags
and the overall concentration gives an estimate of the numerical uncertainty in the
contribution estimates. The tagged species are included as additional species in the
model output files.
The OPTM and PPTM techniques can be used by air quality planners to
identify the contributors to a particular air pollution problem. The tagging method-
ology differs from typical air quality model sensitivity simulations in which the
emissions are modified or omitted. Sensitivity simulations provide information on
the effects of changes in emissions on the simulation results. In contrast, OPTM
and PPTM provide information about the contribution of emissions from the
tagged sources, relative to the unmodified simulated conditions.
3. OPTM Results
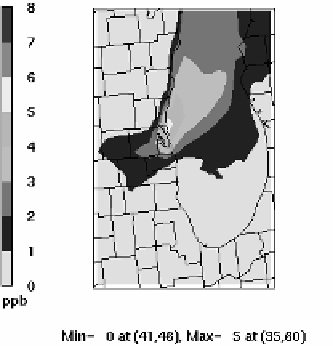
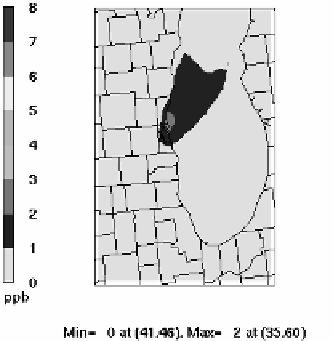
Figure 1
presents example results for the application of CMAQ/OPTM to examine
the contribution of emissions from selected source areas to 8-h average ozone
concentrations in Milwaukee, WI and the surrounding area. For this application,
OPTM tags were applied to anthropogenic emissions sources in selected counties.
This is an example of the use of OPTM to quantifying the contribution of emis-
sions from selected geographical regions to regional ozone concentrations and
ozone concentrations in specific (e.g., nonattainment) areas.
Figure 1 d
isplays the
Fig. 1.
OPTM-derived monthly average contributions to 8-h average ozone from NOx (left) and
VOC (right) emissions for Milwaukee County, WI