Environmental Engineering Reference
In-Depth Information
range until hour 69 where the FMS drops to 0%. Both HYSPLIT and SCIPUFF
exhibit very similar behavior, with the FMS ranging between ~22% and 60%
through the first 60 h of the simulation.
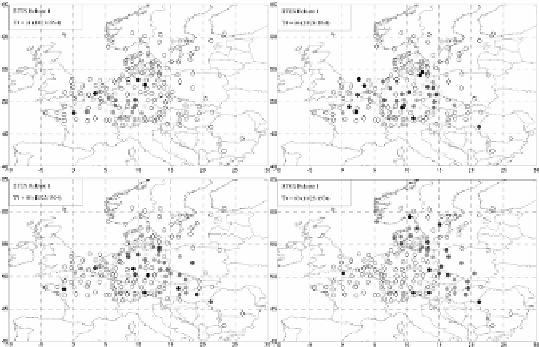
The time series at times T+24, +36, +48, and +60 of both observed concen-
errors in the CALPUFF predicted evolution of the tracer cloud position. Advection
error accounts for the poorer model performance during the ETEX-1 simulation.
Additional investigation is necessary to understand the source of advection error
in the CALPUFF modeling system.
Fig. 3.
Time series of observed concentrations for ETEX-1
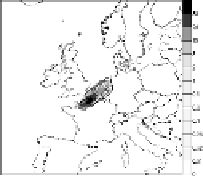
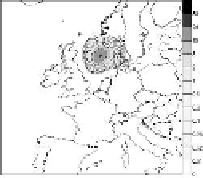
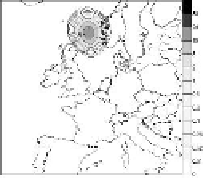
Fig. 4.
Time series of predicted concentrations for the CALPUFF modeling system for ETEX-1