Environmental Engineering Reference
In-Depth Information
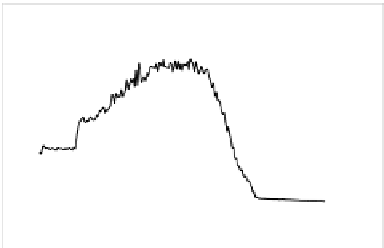
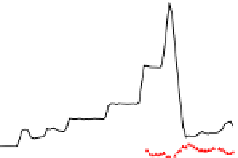
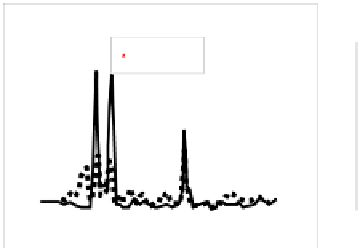
Figure 3
shows two examples of the AURAMS2.5 km simulations compared to
observations. Figure 3a shows a comparison between NO
2
predictions and 2 min
averaged NO
2
observations on board the NRC Twin Otter on July 7. The model
captures the timing of three plumes of NO
2
observed in the measurement record,
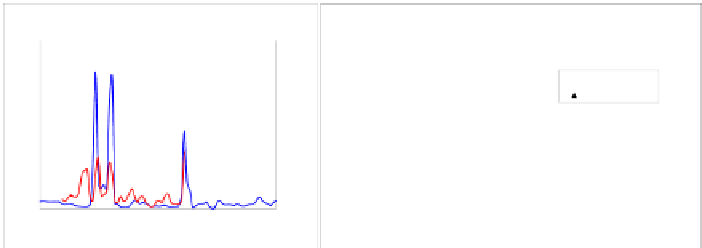
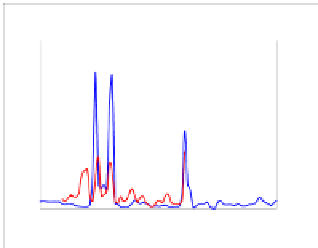
associated with major point source emissions in the city of Sarnia. Figure 3b shows
a comparison between AURAMS2.5 km SO
2
and observations taken aboard the
CRUISER mobile laboratory on July 3, while CRUISER was circumnavigating
the city of Windsor. The model captures the magnitude of the SO
2
plume, but
misses some of the fine structure present in the measurement record.
The AURAMS analysis of BAQS-Met and the development of GEM-MACH15
are both on-going projects, and the above results give the state of progress of these
projects at the time of writing. Further updates and improvements to both models
are underway; updated and revised results will be presented at the NATO-ITM
itself. From the work to date, GEM-MACH15 outperforms AURAMS15 for ozone
prediction accuracy, while the reverse is true for PM2.5, by correlation coefficient.
Current work with GEM-MACH15 is focused on determining the cause of the
PM
2.5
SO
4
over-predictions. Both models show a good ability to predict the timing
of ozone and PM events.
Twin Otter Flight 14 July-7-2007
Twin Otter Flight 14 July-7-2007
CRUISER SO2 versus AURAMS2.5km July 3, 2007
12
12
3000
3000
AURAMS_NO2
Aircraft_NO2
Altitude (m)
AURAMS_NO2
Aircraft_NO2
Altitude (m)
60
10
10
2500
2500
50
AURAMS_SO2
CRUISER_SO2
8
8
2000
2000
40
6
6
1500
1500
30
4
4
1000
1000
20
2
2
500
500
10
0
0
0
0
0
2
observations versus AURAMS2.5 km
17:30:00 18:00:00 18:30:00 19:00:00 19:30:00 20:00:00
Time (UTC)
17:30:00 18:00:00 18:30:00 19:00:00 19:30:00 20:00:00
Time (UTC)
22:00:00
22:30:00
23:00:00
23:30:00
00:00:00
00:30:00
01:00:00
01:30:00
02:00:00
Time (UTC)
Fig. 3.
(a): Twin Otter NO
2
observations versus AURAMS2.5 km, (b): CRUISER SO2
observations versus AURAMS2.5 km
References
Cho, S., Makar, P.A., Lee, W.S., Herage, T., Liggio, J., Li, S.-M., Wiens, B., Graham, L.,
Evaluation of A Unified Regional Air-quality Modeling System (AURAMS) using
PrAIRie2005 field study data: the effects of emissions data accuracy on particle sulphate
predictions Atmospheric Environment 43 (2009) 1864-1877.
Côté, J., S. Gravel, A. Méthot, A. Patoine, M. Roch, and A. Staniforth, The operational CMC-
MRB Global Environmental Multiscale (GEM) model. Part 1: Design considerations and
formulation.
Monthly Weather Review
,
126
, 1373-1395 (1998).
Gong, W., A.P. Dastoor, V.S. Bouchet, S.L. Gong, P.A. Makar, M.D. Moran, B. Pabla, S.
Menard, L-P. Crevier, S. Cousineau and S. Venkatesh, Cloud processing of gases and
aerosols in a regional air quality model (AURAMS),
Atmospheric Research
(82): 248-275,
2006.