Environmental Engineering Reference
In-Depth Information
well. For receptors within the canopy numerical data slightly under-predict but in
principal follow the same trend as the field data. On the other hand wind tunnel
data present two peaks at receptors R3 and R6. All models present a peak at
receptor R10. This is due to the fact that the modeled flow is over-estimated at that
region because of no upwind blockage. Other discrepancies within the canopy
could be associated with the absence of traffic induced turbulence which can
dominate local flow patterns at these low ambient wind speed conditions. For this
reason a two-fluid approach has been adopted to account for traffic induced turbu-
lence. The model is able to explicitly model individual vehicles whose movement
is controlled by a traffic micro-simulation code.
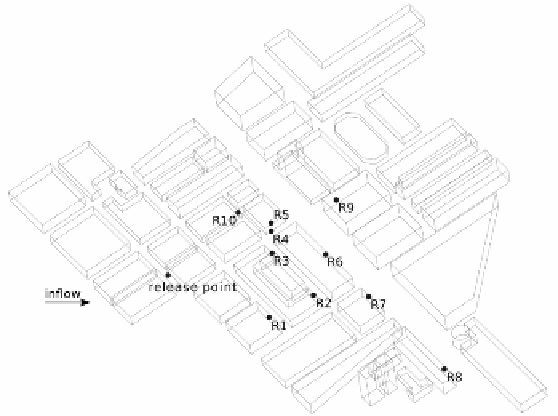
Fig. 1.
Schematic of the computational domain, including the tracer source and receptor
locations. Note: release point and all receptors are placed at ~1.8 m above ground level, except
for R5 which is placed at roof-top
4. Conclusions
A novel LES method with anisotropic mesh adaptivity is implemented and
compared against field and physical model data. Results are comparable to field
data (5-10% error). Discrepancies are considered to have originated mainly from
the lack of traffic induced turbulence. Future work includes simulating the same
problem including traffic induced turbulence.