Agriculture Reference
In-Depth Information
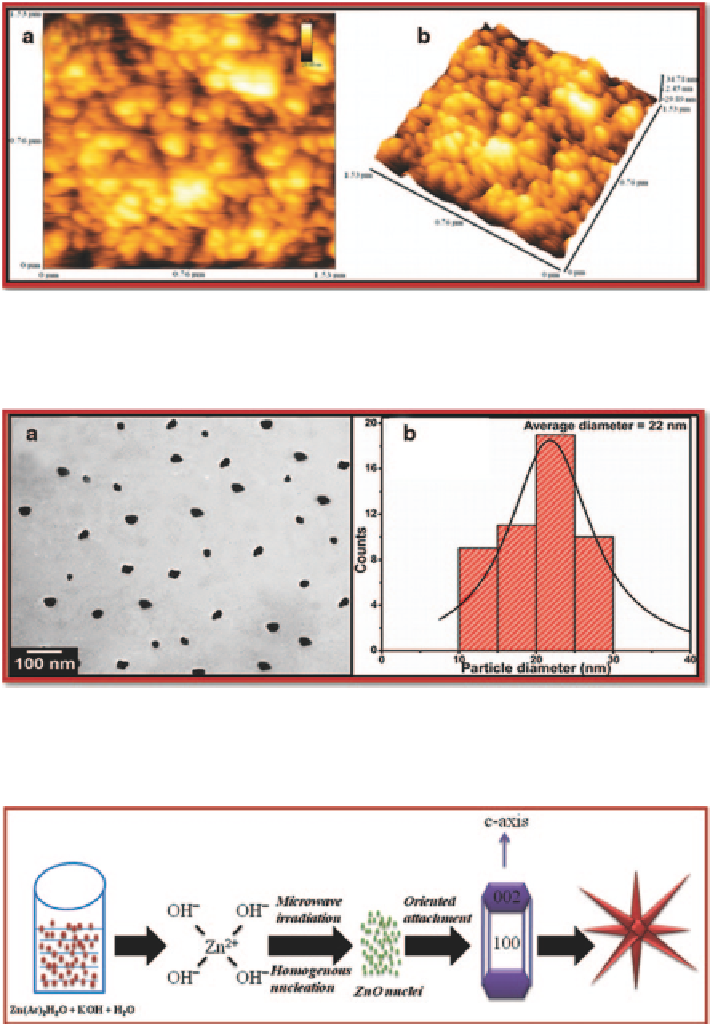
Fig. 11.5
AFM images of silver nanocrystals
a
2D preview
b
3D preview. (Adopted with kind
permission from Arshi et al.
2011b
)
Fig. 11.6 a
TEM image of silver nanocrystals
b
corresponding statistical size distribution histo-
gram. (Adopted with kind permission from Arshi et al.
2011b
)
Fig. 11.7
Schematic diagram of the formation process of flowerlike ZnO nanostructures. (Adopted
with kind permission from Ahmed et al.
2011a
)