Agriculture Reference
In-Depth Information
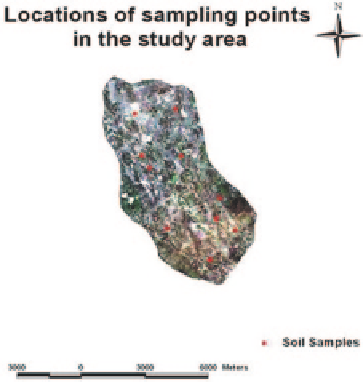
Fig. 4.2
Location of sam-
pling points in the study area
data and cartographic maps. The satellite data set used in this study consists of six
images of Landsat TM with the spatial resolution of 30 m. Field data and geo-ref-
erenced tea plantation maps which were prepared by Panabokke et al. (
2008
), were
used to identify the existing tea fields in satellite images. Spectral signatures of tea
plantations were studied in detail to identify their spatial and temporal variation.
3.1 Sampling and Analysis
Approximately 50 km
2
area was selected as area of interest (AOI) which includes
two tea estates, namely St. Joachim and Palm garden. The area was demarcated
by including those two estates with small holder's tea gardens. Yield data were
obtained from the two estates for a period of past 10 years for the analysis. Soil
and groundwater samples were collected from non-agricultural lands within the
same area. Soil samples, up to 45 cm depth were taken by excluding top soil and
groundwater samples were taken from dug wells. Polypropylene bottles were used
to keep acidified (few drops of 2 % HNO
3
was added to water samples while sam-
pling process and those samples were used to metal analysis) and non-acidified
water samples, other than soil and groundwater samples, water samples were col-
lected separately from the River “Kaluganga”. Properly labelled samples were then
brought into the laboratory for further analysis (Fig.
4.3
).
3.2 Image Analysis
The imageries for different years were downloaded from www.glovis.usgs.org,
WIST (Warehouse Inventory Search Tool) and GLCF (Global Land Cover Facility).