Biomedical Engineering Reference
In-Depth Information
(a)
(b)
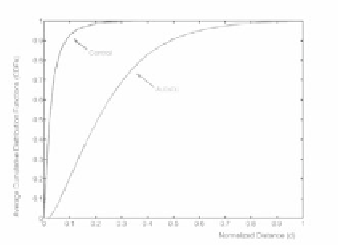
Figure 14.
Average cumulative distribution functions inside theWMof four autistic subjects
and six controls: (a) from postmortem data; (b) from savant data. See attached CD for
color version.
(a)
(b)
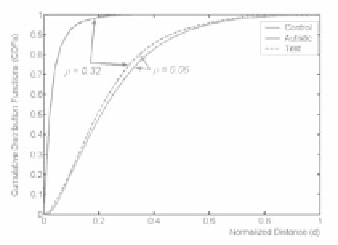
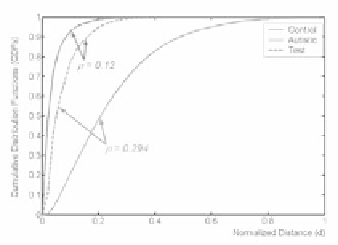
Figure 15.
Illustration of using the proposed classification approach: (a) green CDF is
classified as normal; (b) green CDF is classified as autistic. The parameter
ρ
denotes the
Levy distance. See attached CD for color version.
Table 1.
Performance of the Classification Approach,
Based on Analysis of the WM, When Applied
to Postmortem and Savant Datasets
Confidence Rate
Autistic
Normal
Postmortem Savant
Postmortem Savant
85%
14/14
13/15
12/12
30/30
90%
13/14
12/15
12/12
30/30
95%
13/14
11/15
11/12
28/30


