Biomedical Engineering Reference
In-Depth Information
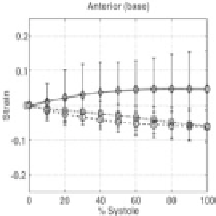
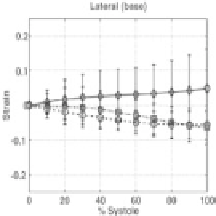
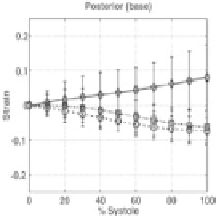
Figure 20.
Average Lagrangian normal strain plots across three normal canine datasets for
the six basal regions of the left ventricle. The different geometric shapes (diamond, circle,
and square) represent the radial, circumferential, and longitudinal strain values, respectively.
The
x
axis marks the time point during systole.
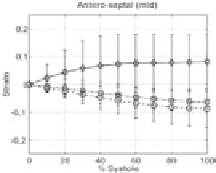
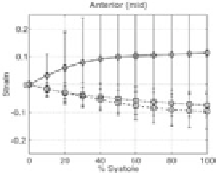
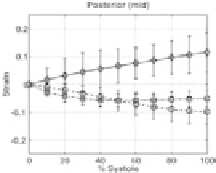
Figure 21.
Average Lagrangian normal strain plots across three normal canine datasets for
the six mid-cavity regions of the left ventricle. The different geometric shapes (diamond,
circle, and square) represent the radial, circumferential, and longitudinal strain values,
respectively. The
x
axis marks the time point during systole.