Biomedical Engineering Reference
In-Depth Information
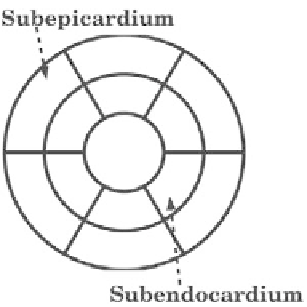
Figure 11.
Diagrammatic representation of the regional division for analysis using Arts'
model for a basal or mid-cavity short-axis view. The arrows point to one of six subendo-
cardial or subepicardial regions.
Table 4.
Optimal Confidence Values for the
Four Models Shown in Figure 12
Optimal Confidence Values
Normals
Plane Inters.
Contour/Tag Inters.
Model 1.1
0.5
50.0
1.0
Model 1.2
0.5
50.0
1.0
Model 2.1
0.5
50.0
1.0
Model 2.2
0.5
50.0
1.0
In Figure 12 we give Bland-Altman plots for each of the four models' top
performer. Each plot has the same scale for both the abscissa and ordinate values.
The plots illustrate that the two Cartesian models (models 1 and 2) outperform
the cylindrical and prolate spheroidal parameterized models with non-Cartesian
B-spline descriptions (models 3 and 4, respectively).
Due to ease of implementation associated with the Cartesian models and the
requirement for a focus for the prolate spheroidal parameterized models, we used
the Cartesian B-splines with cylindrical parameter assignment for in vivo analysis.
This third-order model has one span in the radial direction (three control points),
four spans in the circumferential direction (four distinct control points), and two
spans in the longitudinal direction (four control points).
We also show the strain prediction variation over the best performing 112 mod-
els (top 50%) (many of the models below the 50% level exhibited ill-conditioned