Biomedical Engineering Reference
In-Depth Information
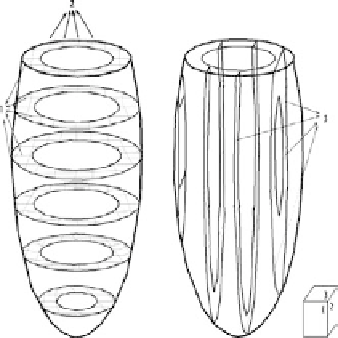
(a) Short-axis tag data
(b) long-axis tag data
Figure 1.
The cube in the lower right illustrates the three orthogonal directions of the tag
plane normals. The intersection of the short-axis image planes with the short-axis tag planes
results in the tag lines marked '1' and '2.' Similarly, the tag lines marked '3' are formed
from the intersection of the long-axis image planes with the long-axis tag planes.
with a slew rate of 200 mT/m/msec and a maximum gradient strength of 40 mT/m.
A breath-hold, segmented k-space ECG-gated SPAMM pulse sequence with 100%
k-space coverage, and five segments was used to collect multiple images in both
short-axis and long-axis views of the entire heart without gaps. Immediately after
the R-wave of the electrocardiogram, radio-frequency (RF) tagging pulses were
applied in two orthogonal directions. The temporal resolution of the imaging
sequence was 32.0 msec (note, however, that the real repetition time (TR) = 32.0/5
= 6.4 msec), the echo time (TE) was 2.8 msec, the RF pulse flip angle was 20
◦
,
the bandwidth was 184 Hz/pixel, and the time extent of RF tag pulses was 2.2
msec. Other imaging parameters were: field of View = 300
×
300 mm
2
, in-plane
1.17 mm
2
, and slice thickness = 8 mm. The tag spacing
(grid tag pattern in the short-axis images and stripes in the long-axis images) was
chosen to be 8 mm due to practical limitations in automated delineation of tags
with smaller separation.
resolution = 1.17
×
1.2. Relevant Work
Early techniques for evaluating myocardial deformation based on B-splines
were restricted to 2D short-axis techniques [10, 11]. Although fast, such tech-
niques did not take into account myocardial through-plane motion. Extension to
more comprehensive 3D analysis was based on the geometrical configuration of
the MR tag planes. This configuration is conducive to tag analysis using B-spline