Biomedical Engineering Reference
In-Depth Information
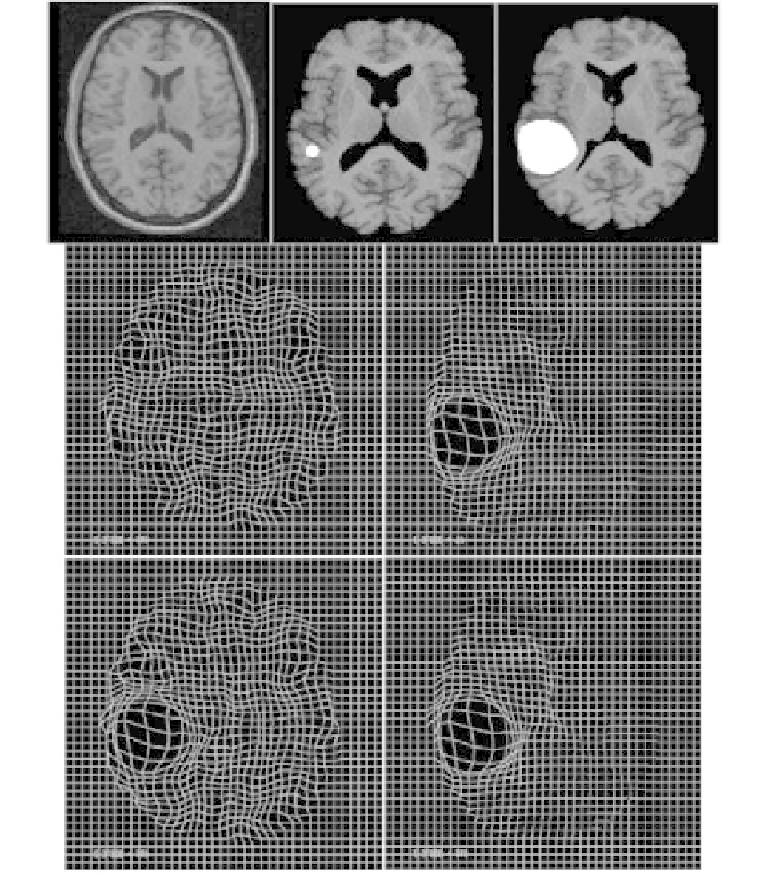
Figure 20.
Illustration of a tumor mass-effect simulation and the associate displacement
maps. Top row (left to right): atlas image, normal subject's MR image with an intro-
duced small tumor, and resulting image after simulation of tumor mass-effect. Middle
row: displacement map
u
c
(left) and displacement map
ϕ
d
−
X
S
(right). Bottom row:
displacement map
u
d
(left) and displacement map
u
c
(right). Copyright c
2006, Elsevier
B. V.