Biomedical Engineering Reference
In-Depth Information
1.7
2.5
e
=
0.15
0.3
0.4
0.45
0.475
0.485
0.49
0.495
e
=
0.2
e
=
0.25
e
=
0.3
e
=
0.4
2.4
1.6
2.3
1.5
2.2
2.1
1.4
2
1.3
1.9
1.2
1.8
1.7
1.1
2000
4000
6000
8000
10000
12000
14000
16000
4000
5000
6000
7000
8000
9000
10000
11000
12000
P, Pa
P, Pa
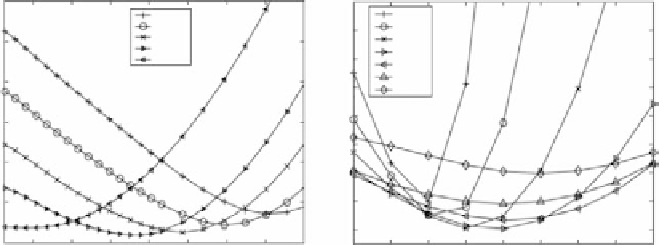
Figure 16.
Example curves of the mean errors in the displacement of landmark points
for two cases in the dataset. (a) Curves for DC1 at different values of
P
and
e
, and for
υ
=0
.
49
. (b) Curves for HC at different values of
P
and
υ
, and
e
=0
.
3
.
4.3.7.3. Material Stiffness
Values of the brain tissue's stiffness reported in the
literature range over several orders of magnitude. For example, the asymptotic
shear modulus at small strains predicted by Prange and Margulies [93] for human
graymatter was
µ
o
≈
60
.
3 Pa, which translates into an equivalent Young'smodulus
of
E
o
= 181 Pa at small strains. On the other hand, a value of
E
o
= 180 kPa was
used by Kyriacou et al. [79] for gray matter.
Since the loads in the proposedmass-effect model are in the formof a pressure,
P
, and a prescribed strain
e
, the resulting deformation will depend on the ratio
P/E
o
and on
e
, but not on the value of
P
alone. Therefore, choosing different
values for
E
o
, but the same value of
P/E
o
, will provide the same deformation
for a certain value of
e
. However, the generated stresses at a certain strain value
will depend on the value of
E
o
used for the brain tissues. This observation was
confirmed through actual FE simulations. Accordingly, we adopted the value of
µ
= 842 Pa found by Miller and Chinzei for the used hyerpelastic material model
[92]. For a perfectly incompressible material, this translates into
E
o
= 2526 Pa.
4.3.7.4.Material Compressibility
For each case in the dataset, simulations were
performed to determine the values of
P
and
e
according to the following sequence.
With
υ
=0
.
49 [94] (which implies
E
o
= 2109 Pa,
D
1
≈
4
.
75
×
10
−
5
Pa,
e
, and
P
were varied for each case, and the mean error in model predictions of the landmark
locations was computed. Values of
e
for minimum error were recorded for each
case. Representative error curves for cases DC1 are shown in Figure 16a.
With the value of
e
determined for each case, simulations were then run for
υ
∈
[1
,
16] kPa. FE tetrahedra with special formulation for
incompressibility were used for all simulations. Representative mean error curves
for HC are shown in Figure 16b. For all tumor cases, the minimum mean error
∈
[0
.
3
,
0
.
499] and
P