Biomedical Engineering Reference
In-Depth Information
Table 1.
Description of MRI Scans for
the Dataset Used in This Study
Identifier
Image Size
Voxel Size (mm)
Scan Type
DC1
256x256x100
0.391x0.391x0.7
MPRAGE+Gd
DC2
256x256x100
0.391x0.391x0.7
MPRAGE+Gd
DC3
256x256x124
0.46875x0.46875x1.0
T1+Gd
HC
256
×
256
×
124
0.9375
×
0.9375
×
1.5
T1
Identifiers DC1, DC2, and DC3 stand for dog cases 1, 2, and 3. Identifier HC refers to the human case.
All scans for each case have the same parameters.
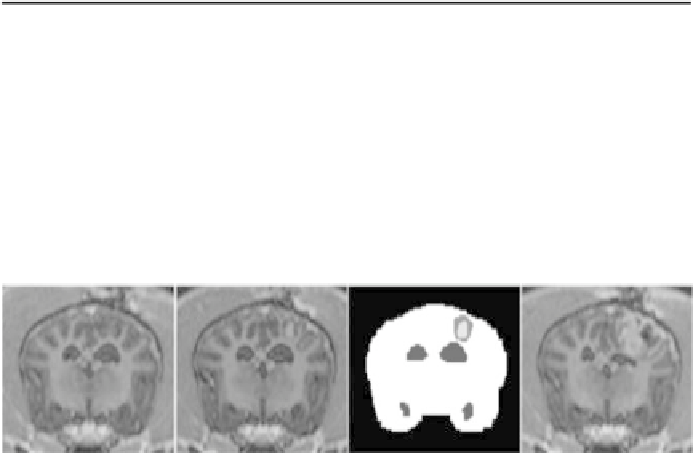
Figure 14.
Corresponding 2D images from volumetric gadolinium-enhanced MPRAGE
scans of DC1. Left to right: before tumor implantation, 6 days post-implantation, segmen-
tation of the 6 days post-implantation image, and 10 days post implantation
scan was acquired before implantation of the tumors, followed by scans on the
sixth and tenth days post-implantation. Gadolinium-enhanced high-resolution
T1-weighted images were acquired (MPRAGE sequences were acquired for the
DC1 and DC2). The tumor grows rapidly to a diameter of 1-2 cm by the tenth
day post-implantation, beyond which the animals were sacrificed and prior to
the presentation of significant neurological complications. The fourth dataset
comes from T1-weighted serial MRI scans of a human subject with a low-grade
astrocytoma (LGA) undergoing malignant transformation before the final scan.
Two scans of this patient were used with approximately 2 years in between. An
increase in the tumor mass and significant tissue swelling due to edema were
observed in between the two scans.
4.3.7.2. Experimental Procedure
To compare the model predictions to actual
deformations in the available datasets, values of the parameters (
c
t
,
r
t
,
r
e
, and
P
)
must be determined for each case. As noted above, for real tumor cases, these
parameters should be estimated through inverse problem solving. To conduct the
experiments needed here, an alternative approach involving the optimization of
the model parameters is used.