Biomedical Engineering Reference
In-Depth Information
(
DD
)
Individual Volume
Average Volume
2800
2800
"hilppocampal formation" right
"hilppocampal formation" right
2600
2600
2400
2400
2200
2200
2000
2000
2
4
6
8
1
2
3
4
5
6
Individual Volume (AE)
Average Volume
2000
2000
"parahippocampal gyrus" left
"parahippocampal gyrus" left
1900
1900
1800
1800
1700
1700
1600
1600
1500
1500
1400
1400
2
4
6
8
1
2
3
4
5
6
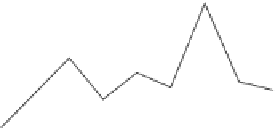
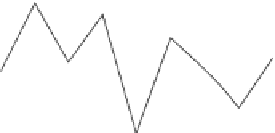
Figure 7.
Example illustrating the problems faced when applying a 3D atlas warping
method independently to each time-point in a longitudinal study. Left: plots of volumetric
measurements from two representative BLSA participants and two structures, using 3D
HAMMER (right hippocampal formation and left parahippocampal gyrus). Right: anal-
ogous plots showing average volumes of these two structures, obtained by averaging the
volumetric measurements of 90 BLSA participants for each of 6 years. Considerable vari-
ation is apparent. For example, the standard deviation around the baseline is about 5% for
the left hippocampus of subject AD. Although a difference of 5% cannot be appreciated by
visual inspection (see Figure 8, below), it can adversely affect the accuracy of longitudinal
measurements. As should be expected, variation of the average hippocampal volume is
much lower (less than 1%) because of the averaging over 90 individuals. See attached CD
for color version.
process are determined via 4D image analysis, which significantly reduces noise
and improves robustness in detecting anatomical correspondence. Put simply, im-
age features that are consistently recognized in all time-points guide the warping
procedure, whereas spurious features, such as noisy edges, appear inconsistently
at different time-points and are eliminated. In [71] this 4D approach was found