Biomedical Engineering Reference
In-Depth Information
(a) Level set function in 3D
(b) Color representation of distance
function
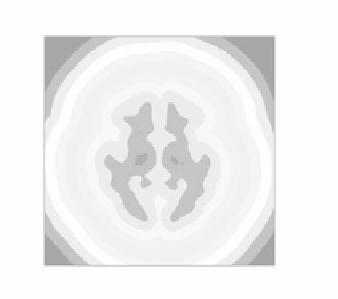
Figure 1.
(a) Representation in three dimensions of the intersection of a level set with the
zero plane. (b) Color contour of the level set function in (a). Colors represent the Euclidean
distance.
See attached CD for color version.
where
R
−
∪
R
+
∪
Γ=Ω, hypersurface Γ is the zero level of
φ
, and
D
(
x
,
Γ)
is the Euclidean distance between
x
and Γ. The gradient of the signed distance
function is
|
=1. It is a good property that can assure numerical stability.
The geometrical quantities of the hypersurface can be easily represented in terms
of level set function
φ
. In this chapter we define the normal of Γ in the direction
of increasing values of
φ
. Thus, the unit normal vector is
|∇
φ
∇
φ
N
=
.
(7)
|∇
φ
|
The mean curvature of the hypersurface is the divergence of the unit normal vector:
κ
=
div
(
∇
φ
)
.
(8)
|∇
φ
|
To represent regions and the hypersurface with a level set function, Heaviside and
Dirac functions [9] are used:
1
dH
(
z
)
dz
z
≥
0
H
(
z
)=
δ
0
(
z
)=
.
(9)
0
z<
0