Biomedical Engineering Reference
In-Depth Information
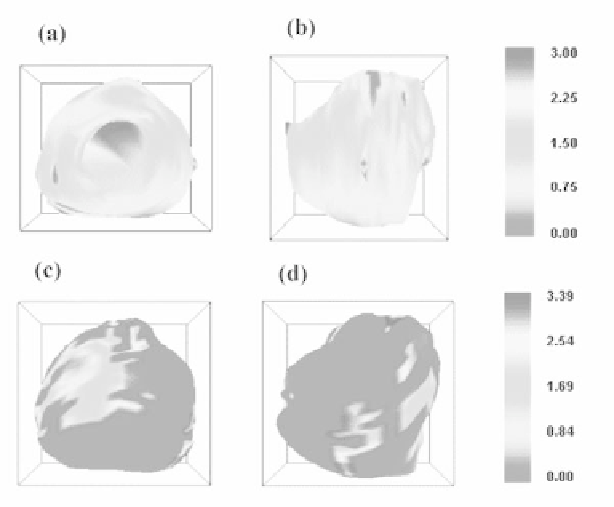
Figure 19.
Local standard deviation maps: (c,d) Local standard deviation mapped on
the average manually segmented boundary. (e,f) Local standard deviation mapped on the
average algorithm-segmented boundary. Red regions indicate zero standard deviation and
blue regions represent maximum standard deviation, which was 3.0 for manual and 3.4 mm
for algorithm segmentation. The left-hand column is a view of the prostate perpendicular
to the transverse plane in the direction from the base to the apex, whereas the right-hand
column is a view perpendicular to the sagital plane in the direction from the patient's right
to left. Reprinted with permission from the AAPM. See attached CD for color version.
the initialization and in editing. In areas where the prostate boundary is weaker or
there is complete signal dropout (shadowing), the variability is increased for both
segmentation approaches because the user must decide where to place vertices.
5.
SUMMARY AND DISCUSSION
Advances in medical imaging over the past decade allow real-time or fast 3D
acquisition, real-time reconstruction, and 3D visualization with real-time image
manipulation, as well as the availability of commercial 3D US systems that have
been shown to be clinically useful by allowing users to focus on demonstrating
clinical utility in a variety of diagnostic and therapeutic applications. Advanced
visualization and measurement tools are allowing the examination of complex
anatomical structures and accurate measurement of complex volumes. These tools