Biomedical Engineering Reference
In-Depth Information
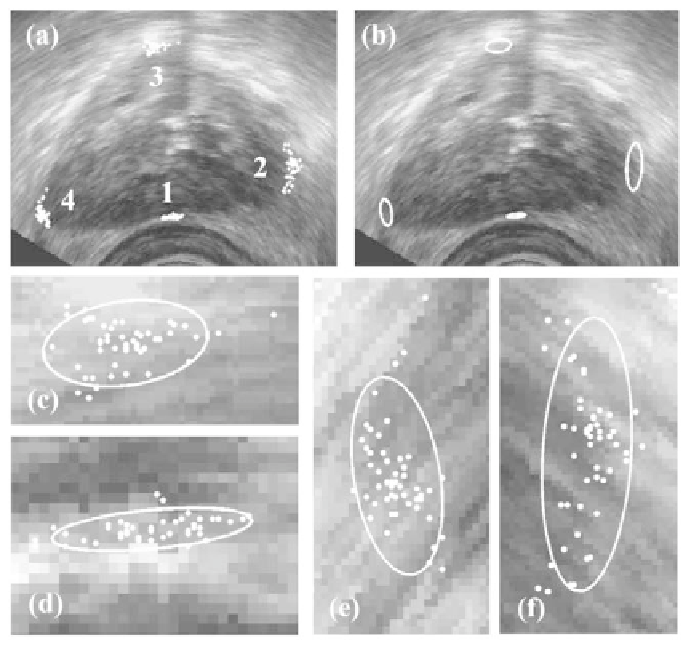
Figure 7.
Construction of population distributions
p
pop
c,i
(
x, y
)
. Shown are (a) all 50 selec-
tions per control point made by five users on 10 different occasions; (b) ellipses enclosing
95% of selections along the principal axes of distributions
p
pop
c,i
(
x, y
)
that are fitted to
samples in (b); closeup views of selections for control points (c) 3, (d) 1, (e) 4, and (f) 2
along with ellipses enclosing the corresponding
p
pop
c,i
(
x, y
)
are also shown. Reprinted with
permission from the AAPM.
Figure 8 shows sample outputs of the third step, the formation of the individual
distributions
p
ind
u,c,i
(
x, y
) describing how user
u
selects control point
c
in TRUS
prostate image
i
. The four panels show closeup views of the spatial extent of the
individual distributions as well as the 10 selections made for control point 1 by:
(a) user 1 and (b) user 2 for the image in Figure 7a, and for control point 2 for:
(c) user 1 and (d) user 2. In total, there are five individual distributions for each
control point in an image because
U
=5users constructed the distributions. Each
distribution has slightly different centers, variances, and principal axes.