Biomedical Engineering Reference
In-Depth Information
Table 1.
Expectation Maximization Algorithm
θ
0
,,i
=0
Initialization:
i
+1E step: compute
M
(
θ
i
do
i
←
)
M step:
θ
i
+1
=
argmax
θ
M
(
θ
)
until
M
(
θ
i
+1
)
−
M
(
θ
i
)
≤
1
0.5
0
250
200
150
100
50
0
(a)
(b)
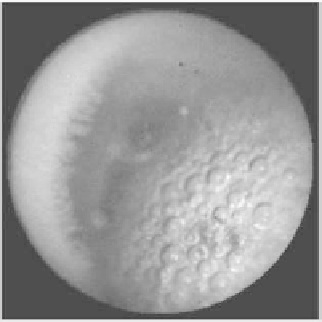
Figure 7.
Likelihood map extraction using color information:
(a) original image; (b)
likelihood map for the bubbles region.
smoothing effect of the gaussian functions, neighboring pixels are likely to have
similar likelihood values, leading to smooth transitions. On the other hand, the
higher likelihood values in a region of interest occur in the inner part of the region
and decrease in the borders. This effect is what we call the “safety region effect”—
due to the fact that it has a high value on “safety” areas, and low likelihood values
elsewhere. The safety areas are usually sub-regions of the regions desired. Due
to both drawbacks, the boundary information must be improved for better results.
There are several ways to improve the technique. In the following subsection we
describe one that is intimately related to the process we have described.
Figure 7 shows the original image and the three-dimensional representation
of the likelihood map for the bubbles region. Observe that the likelihood map
has higher values at the regions where the estimation is more confident about the
presence of bubbles.