Biomedical Engineering Reference
In-Depth Information
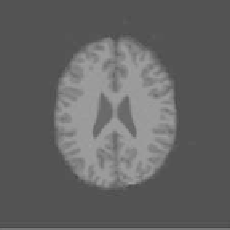
(a)
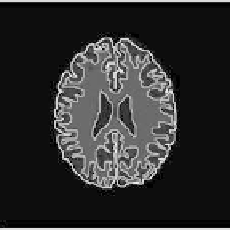
(b)
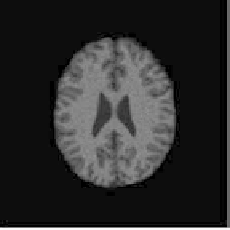
(c)
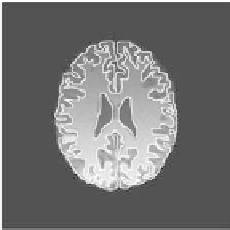
(d)
(e)
(f)
(g)
(h)
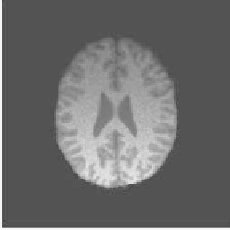
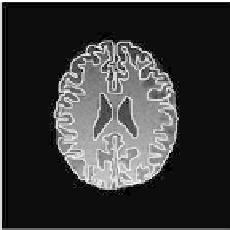
Figure 16.
Results on simulated data with our method for four cases. Left: axial slices
of original data. Right: automatically detected contours on axial slices. (a,b) noise = 3%,
intensity inhomogeities = 0%; (c,d) noise = 9%, intensity inhomogeities = 0%; (e,f) noise
= 3%, intensity inhomogeities = 40%; (g,h) noise = 9%, intensity inhomogeities = 40%.