Biomedical Engineering Reference
In-Depth Information
(a)
(b)
(c)
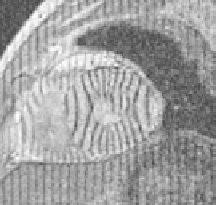
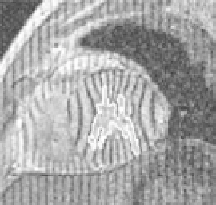
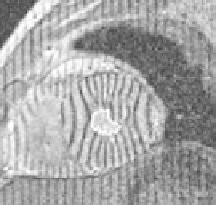
Figure 8.
Segmentation of tagged MRI image: (a) strong tagged MR image; (b) result
obtained using the standard level set method. This result has a serious leak phenomenon
due to the strong tag lines. (c) Improved result obtained using the BPV feature to control
propagation of the front.
4.5. Results and Discussion: Segmentation of tagged MRI Data
Segmentation experiments were performed on the 2D slices of MR images
with weak boundaries and artifacts. For the following experiments, the training
set consisted of 30 nearby slices of the left ventricle.
The first experiment was aimed to demonstrate the effect of the relaxation
factor. Figure 9 shows the result of introducing this factor. By adjusting the value
of the factor
δ
, its influence on stopping the propagating front can be seen clearly.
The first one shows the original leaking problem. The following results were
obtained by setting
δ
to 0.5 and 1.5.
Two other segmentation results from tagged MR and anatomical images are
shown here to demonstrate the effectiveness of the image content, and using the
augmented speed term described in the previous sections. In both examples, by
defining the seed point inside the region of interest, initialization can be done
simply by one mouse click. Then the narrow-band method, as described in Section
3.3, is employed to propagate the front.
The first experiment was carried out on a cardiac MRI and showed the left
ventricle with tag lines. Because of the blood flow, tag lines within the left ventricle
decrease rapidly in the last stage of the cardiac shrink, until they disappear. But tag
lines in the myocardium decrease slowly, which can be seen fromFigure 8a. Inside
the left ventricle the intensity changes are smaller and the relative BPV value is
larger. On the other hand, in the myocardium the intensity changes are larger and
the relative BPV value is smaller. As for images like Figure 8a whose tag lines
are very strong, the weight of the BPV feature should be greater in construction
of the speed term.
In the above experiment, the spatial step length is 1, the temporal step length
0
.
001,
F
A
=
−
20,
β
=5,
µ
=0
.
0025,
γ
= 280, and
δ
=0
.
23. The number of
iterations is 150. As the tag lines in Figure 8 are strong, a large
γ
should be
set, while in other cases it could be small. For MR images without tag lines, we