Information Technology Reference
In-Depth Information
0.1 to 0.2) is introduced to discriminate between less complex behaviors (the
majority of the CA family members) and potentially complex behaviors (character-
ized by long transients
Tran>t1
).
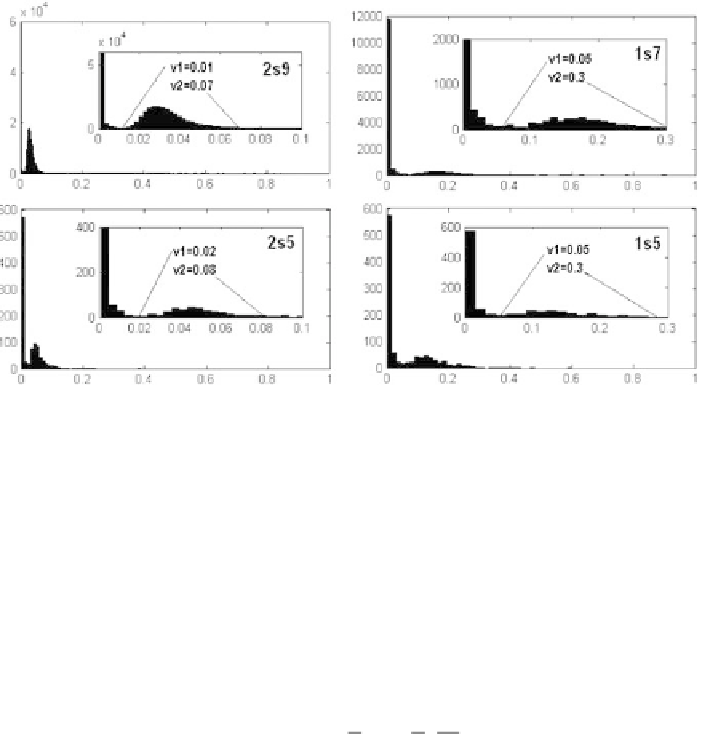
Fig. 4.14.
Distributions of the clustering coefficient variance
Var
for various families of
semitotalistic cellular automata with 2D neighborhoods (
left column
) and 1D neighbor-
hoods (
right column
). The horizontal axis plots the value of
Var
while the vertical axis plots
the fraction of CA from the family exhibiting a certain
Var
value
4.5.2 A Composite Complexity Measure
As a consequence of the above observations, regarding the relationship between
variances and transient lengths a novel, composite measure of complexity is pro-
posed as follows:
1
1
Tr
§
·
(4.5)
Cplx
Var
©
¹
2
2
T
to capture both cases with large variances and large transients and to simplify
plots such as those in Figs. 4.11 or 4.12 from a three-dimensional to a two-
dimensional representation. Such a 2D representation is much easier to analyze.
As seen in Fig. 4.16, the entire “2s5” family is mapped now into a
Cplx
,
plane, each dot representing a particular cell ID and being labeled accordingly.
Such maps allow an easy selection of a certain ID within an area associated with
a certain qualitative behavior. Although ID labels in this figure overlap, a sieve
as defined in Chap. 6 may be applied to plot only a limited number of IDs, i.e.
those within the restrictions imposed by the “sieve”.
Clus
Search WWH ::

Custom Search